
All posts by Robert Wright
Seven key charts for investors to keep an eye on
By Robert Wright /December 01,2023/

Introduction
At the start of this year, we thought shares would have reasonable returns albeit it wouldn’t be smooth sailing given ongoing issues around inflation, interest rates, the risk of recession and geopolitics. So far so good. This note updates seven key charts we see as critical for the investment outlook.
Chart 1 – global business conditions PMIs
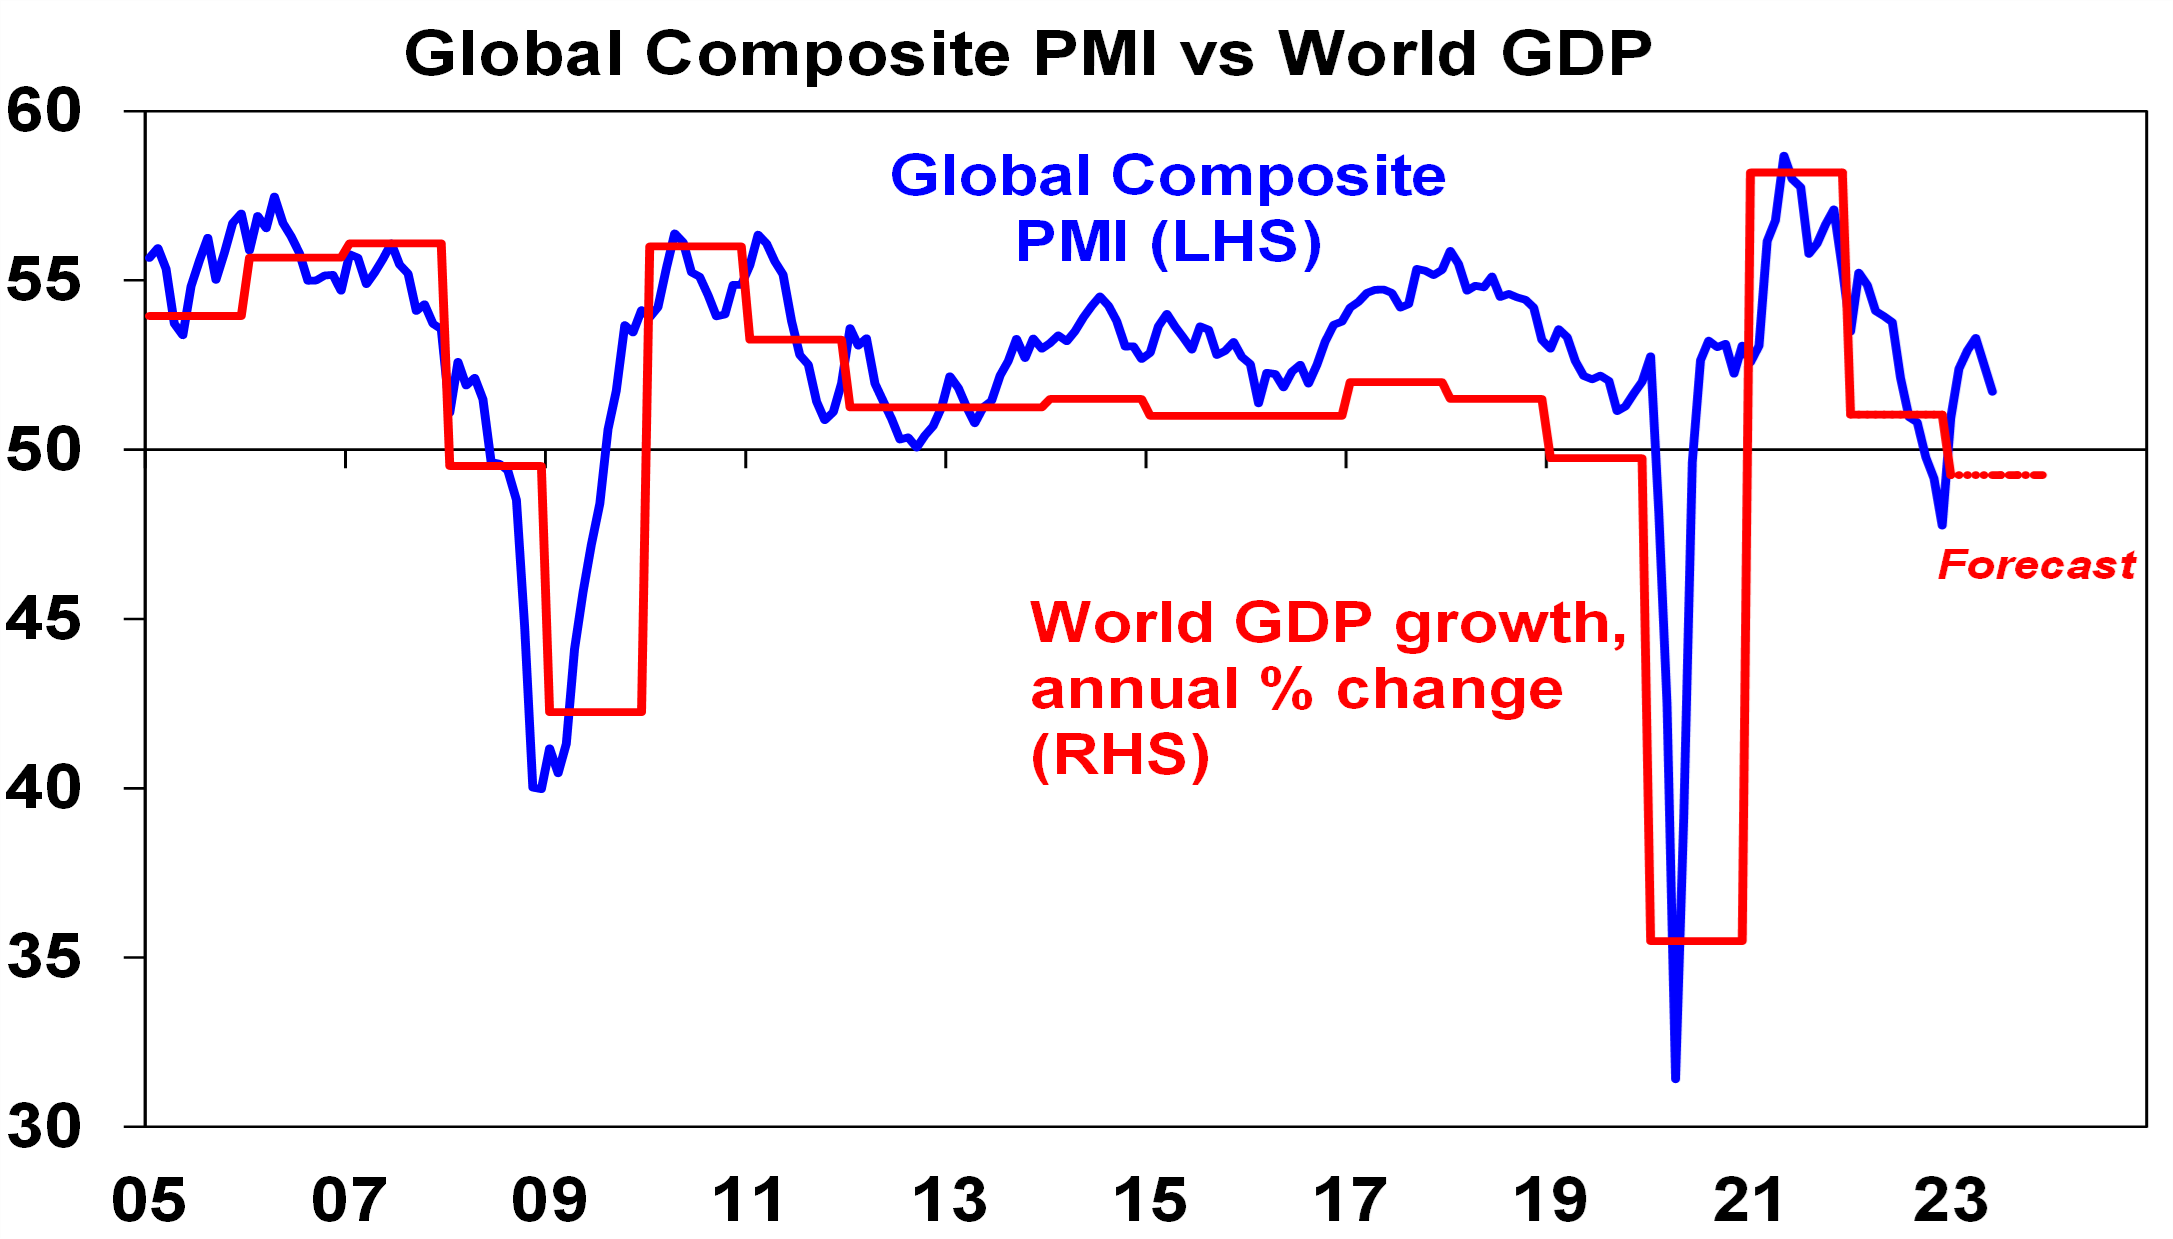
A big determinant of whether share markets can move higher or resume the bear market in US and global shares that started last year, will be whether major economies slide into recession and, if so, how deep that is. Our assessment is that the risk of a mild recession is high (particularly in Australia), but that at least a deep recession should be avoided. Global business conditions indexes (PMIs) – which are surveys of purchasing managers at businesses – will be a key warning indicator.
Source: Bloomberg, AMP
So far, they have proven resilient. While slowing again after a bounce – partly due to China – they are at levels consistent with okay global growth.
Chart 2 (and 2b) – inflation
Of course, a lot continues to ride on how far key central banks raise interest rates. And as has been the case for the last 18 months or so the path of inflation will play a key role in this. Over the last six months the news on this front has continued to improve with inflation rates in key countries rolling over. US inflation has now fallen from 9.1% YOY a year ago to 3% in June and our US Pipeline Inflation Indicator – reflecting a mix of supply and demand indicators – continues to point to a further decline. This reflects a combination of lower commodity prices, improved supply, lower transport costs and easing demand. Just as goods price inflation led on the way up, it’s now leading on the way down with services inflation rolling over as well.

Source: Bloomberg, AMP
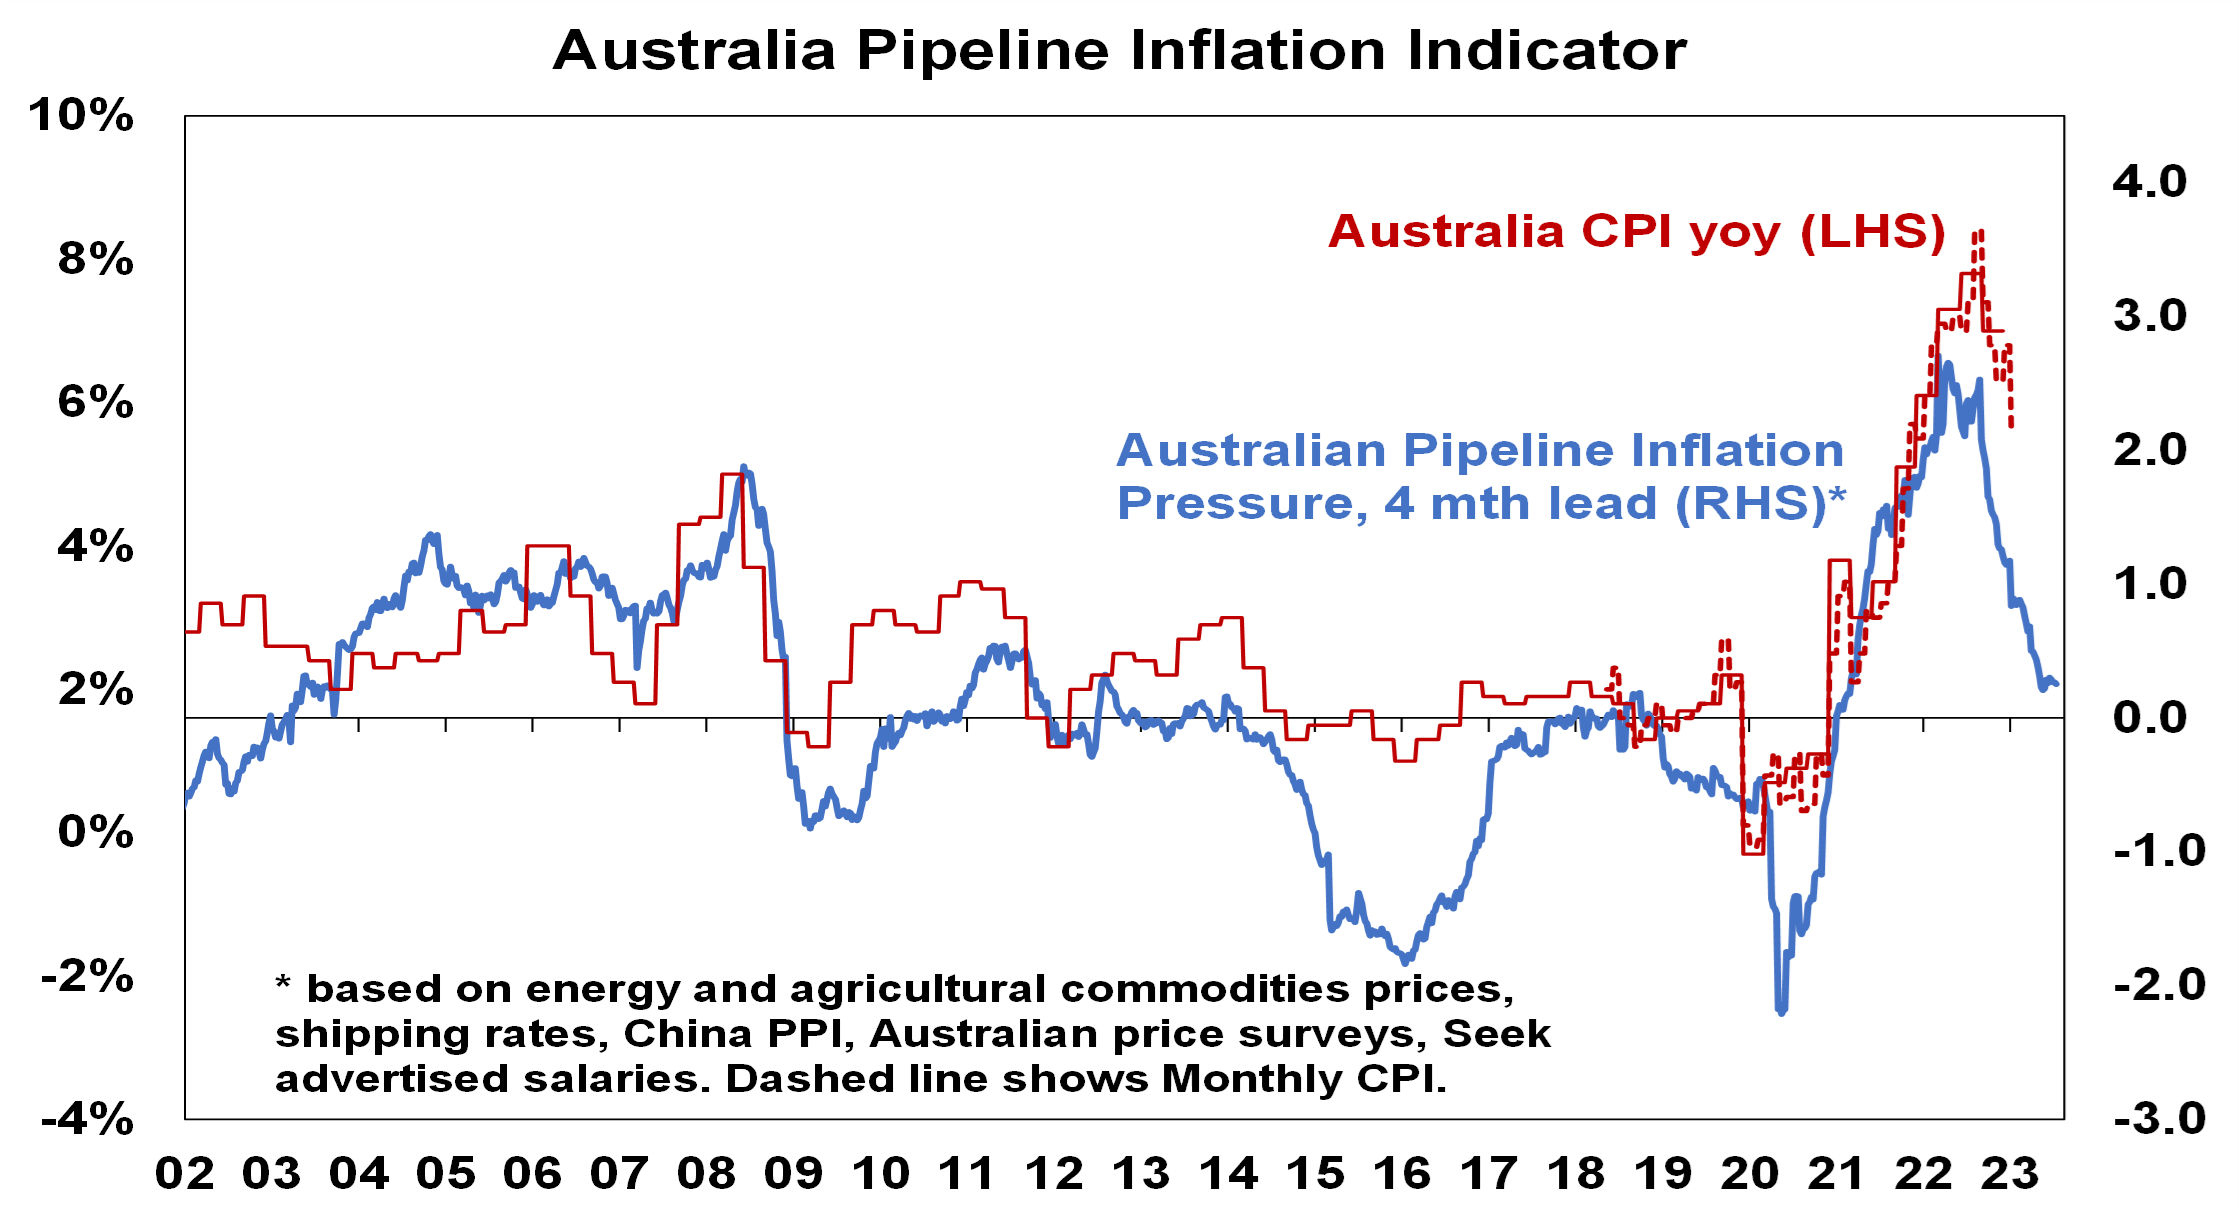
Australian inflation is lagging the US by 6 months, but our Australian Pipeline Inflation Indicator suggests inflation here will continue to fall, even though we did see a rise in the September quarter of 1.2 per cent due to the uncertainty brought on by the Israel and Palestine conflict. The RBA has maintained its position in holding rates higher for longer to stop inflation. Our assessment is that the RBA is close to the top with rate cuts starting in February next year.
Source: Bloomberg, AMP
Chart 3 – unemployment and underemployment
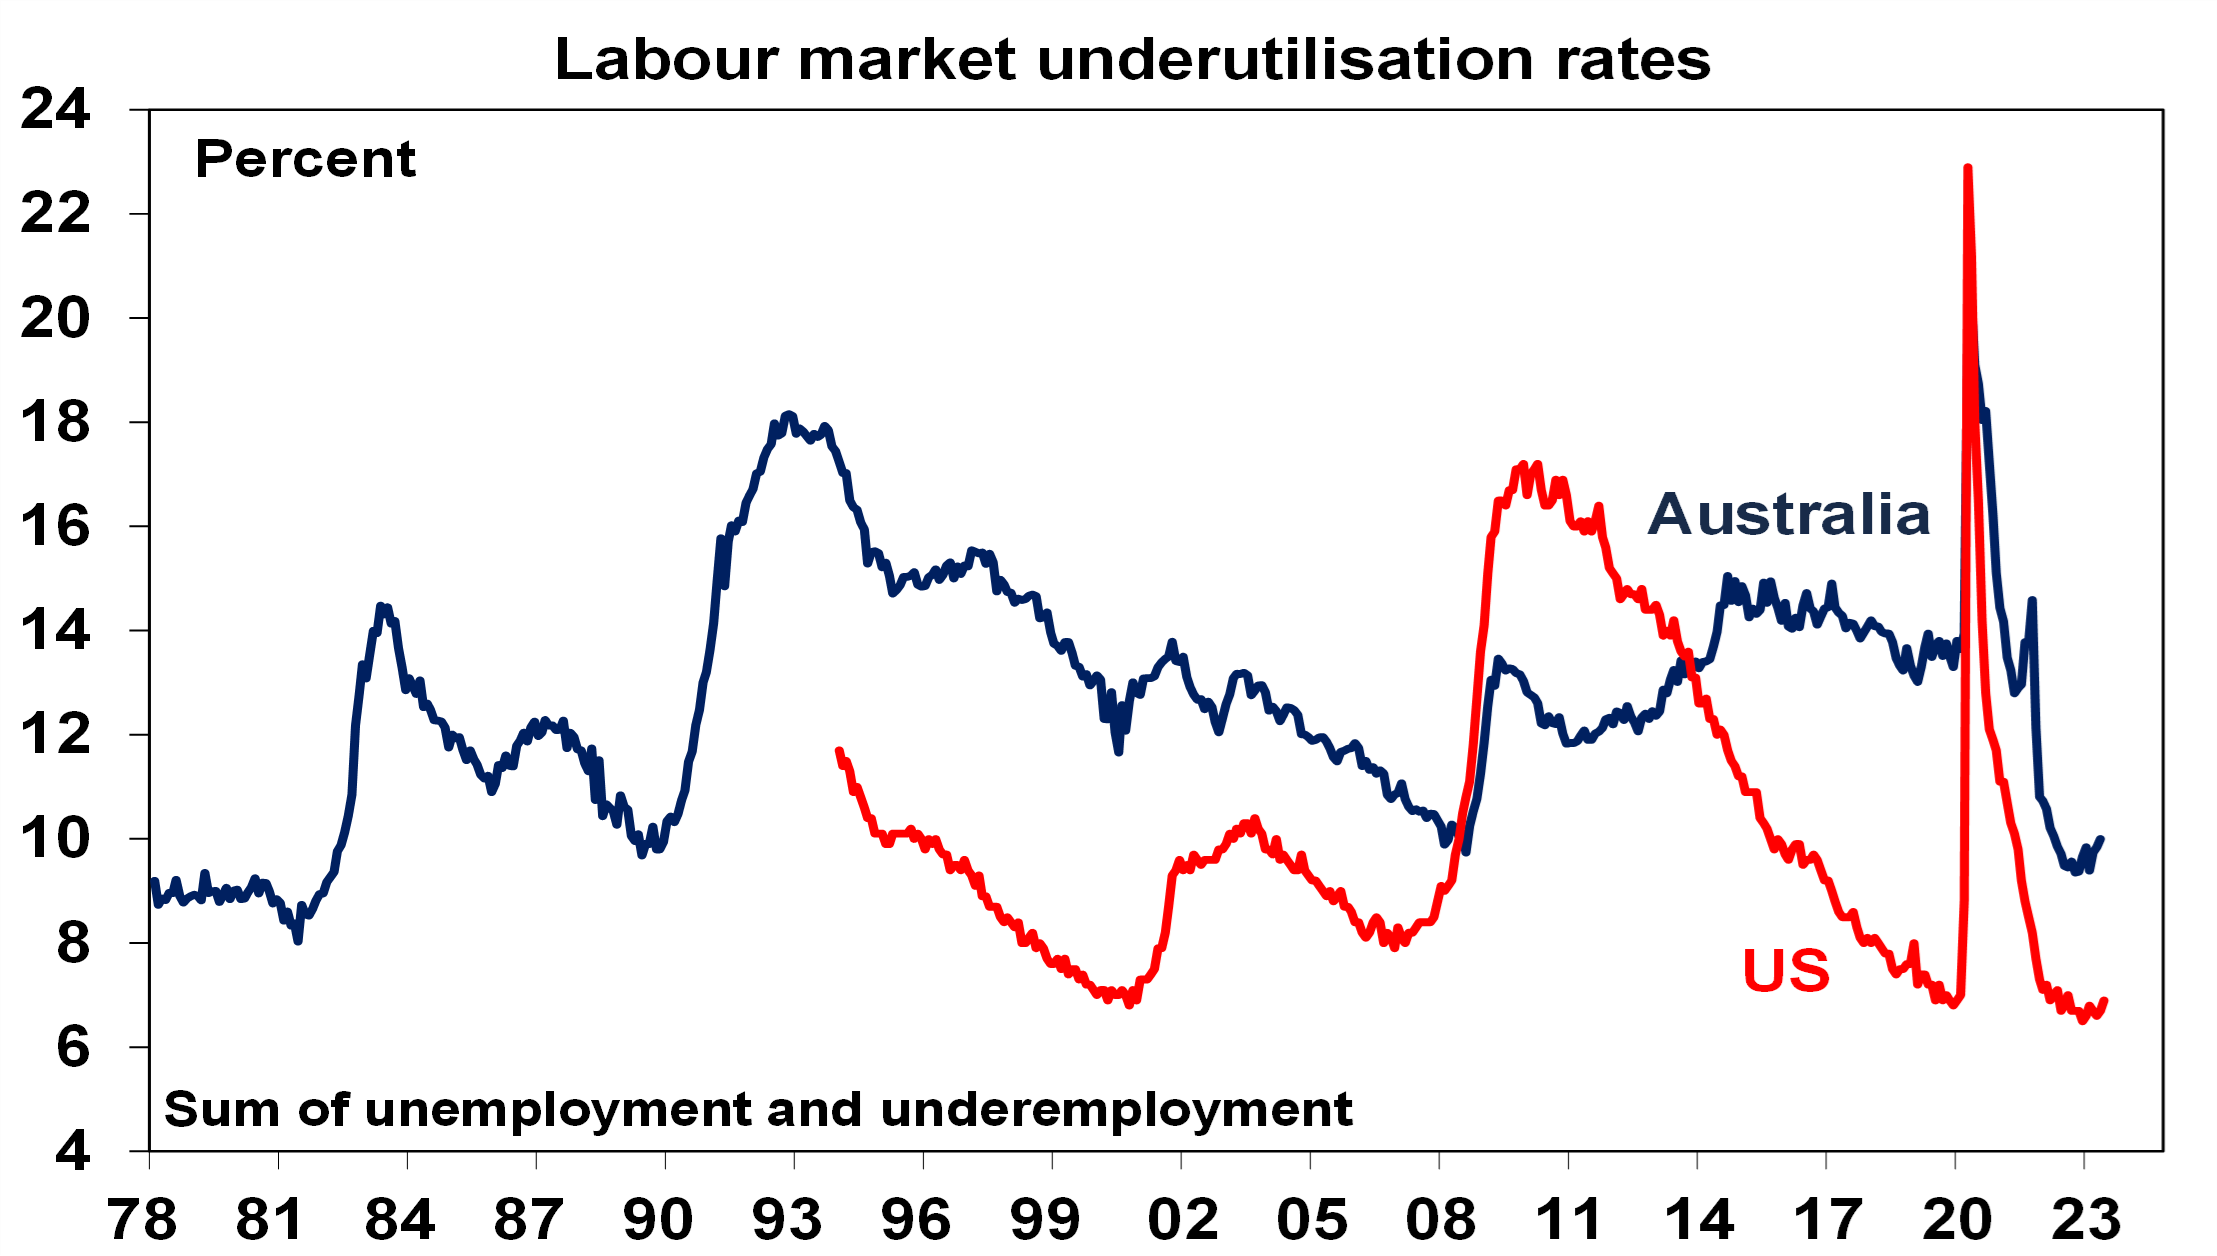
Also critical is the tightness of labour markets as this will determine wages growth which has a big impact on services inflation. If wages growth accelerates too much in response to high inflation, it risks locking in high inflation with a wage-price spiral which would make it harder to get inflation down. Unemployment and underemployment are key indicators of whether this will occur or not. Both remain low in the US and Australia (putting upwards pressure on wages), but there is increasing evidence that labour markets are cooling. Wages growth is still rising in Australia (with the announcement effect of faster increases in minimum and award wages adding to this) but wages growth in the US looks to have peaked.
Source: Bloomberg, AMP
Chart 4 – longer term inflation expectations
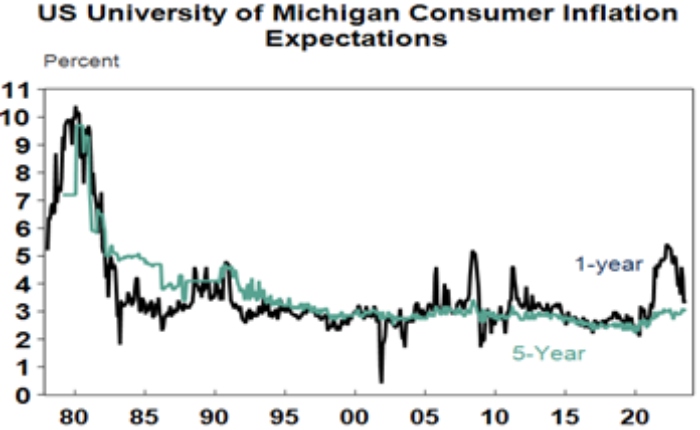
The 1970s experience tells us the longer inflation stays high, the more businesses, workers and consumers expect it to stay high and then they behave in ways which perpetuate it – in terms of wage claims, price setting and tolerance for price rises. The good news is that short term (1-3 years ahead) inflation expectations have fallen sharply and longer term inflation expectations remain in the low range they have been in for the last three decades. This is very different from 1980 when inflation expectations were around 10% and deep recession was required to get inflation back down.
Source: Macrobond, AMP
Chart 5 – earnings revisions
Consensus US and global earnings growth expectations for this year have been downgraded to around zero with a 10% rise next year and for Australia the consensus expects a 3% fall this financial year.

Source: Reuters, AMP
A recession resulting in an earnings slump like those seen in the early 1990s, 2001-03 in the US and 2008 would be the biggest risk but recently revisions to earnings expectations have been moving up.
Chart 6 – the gap between earnings and bond yields
Since 2020, rising bond yields have weighed on share market valuations. As a result, the gap between earnings yields and bond yields (which is a proxy for shares’ risk premium) has narrowed to its lowest since the GFC in the US and Australia. Compared to the pre-GFC period shares still look cheap relative to bonds, but this is not the case compared to the post GFC period suggesting valuations may be a bit of a constraint to share market gains as current uncertainties suggests investors may demand a risk premium over bonds similar to that seen post GFC as opposed to what was seen pre GFC. Australian share valuations look a bit more attractive than those in the US though helped by a higher earnings yield (or lower PEs). Ideally bond yields need to decline and earnings downgrades need to be limited.

Source: Reuters, AMP
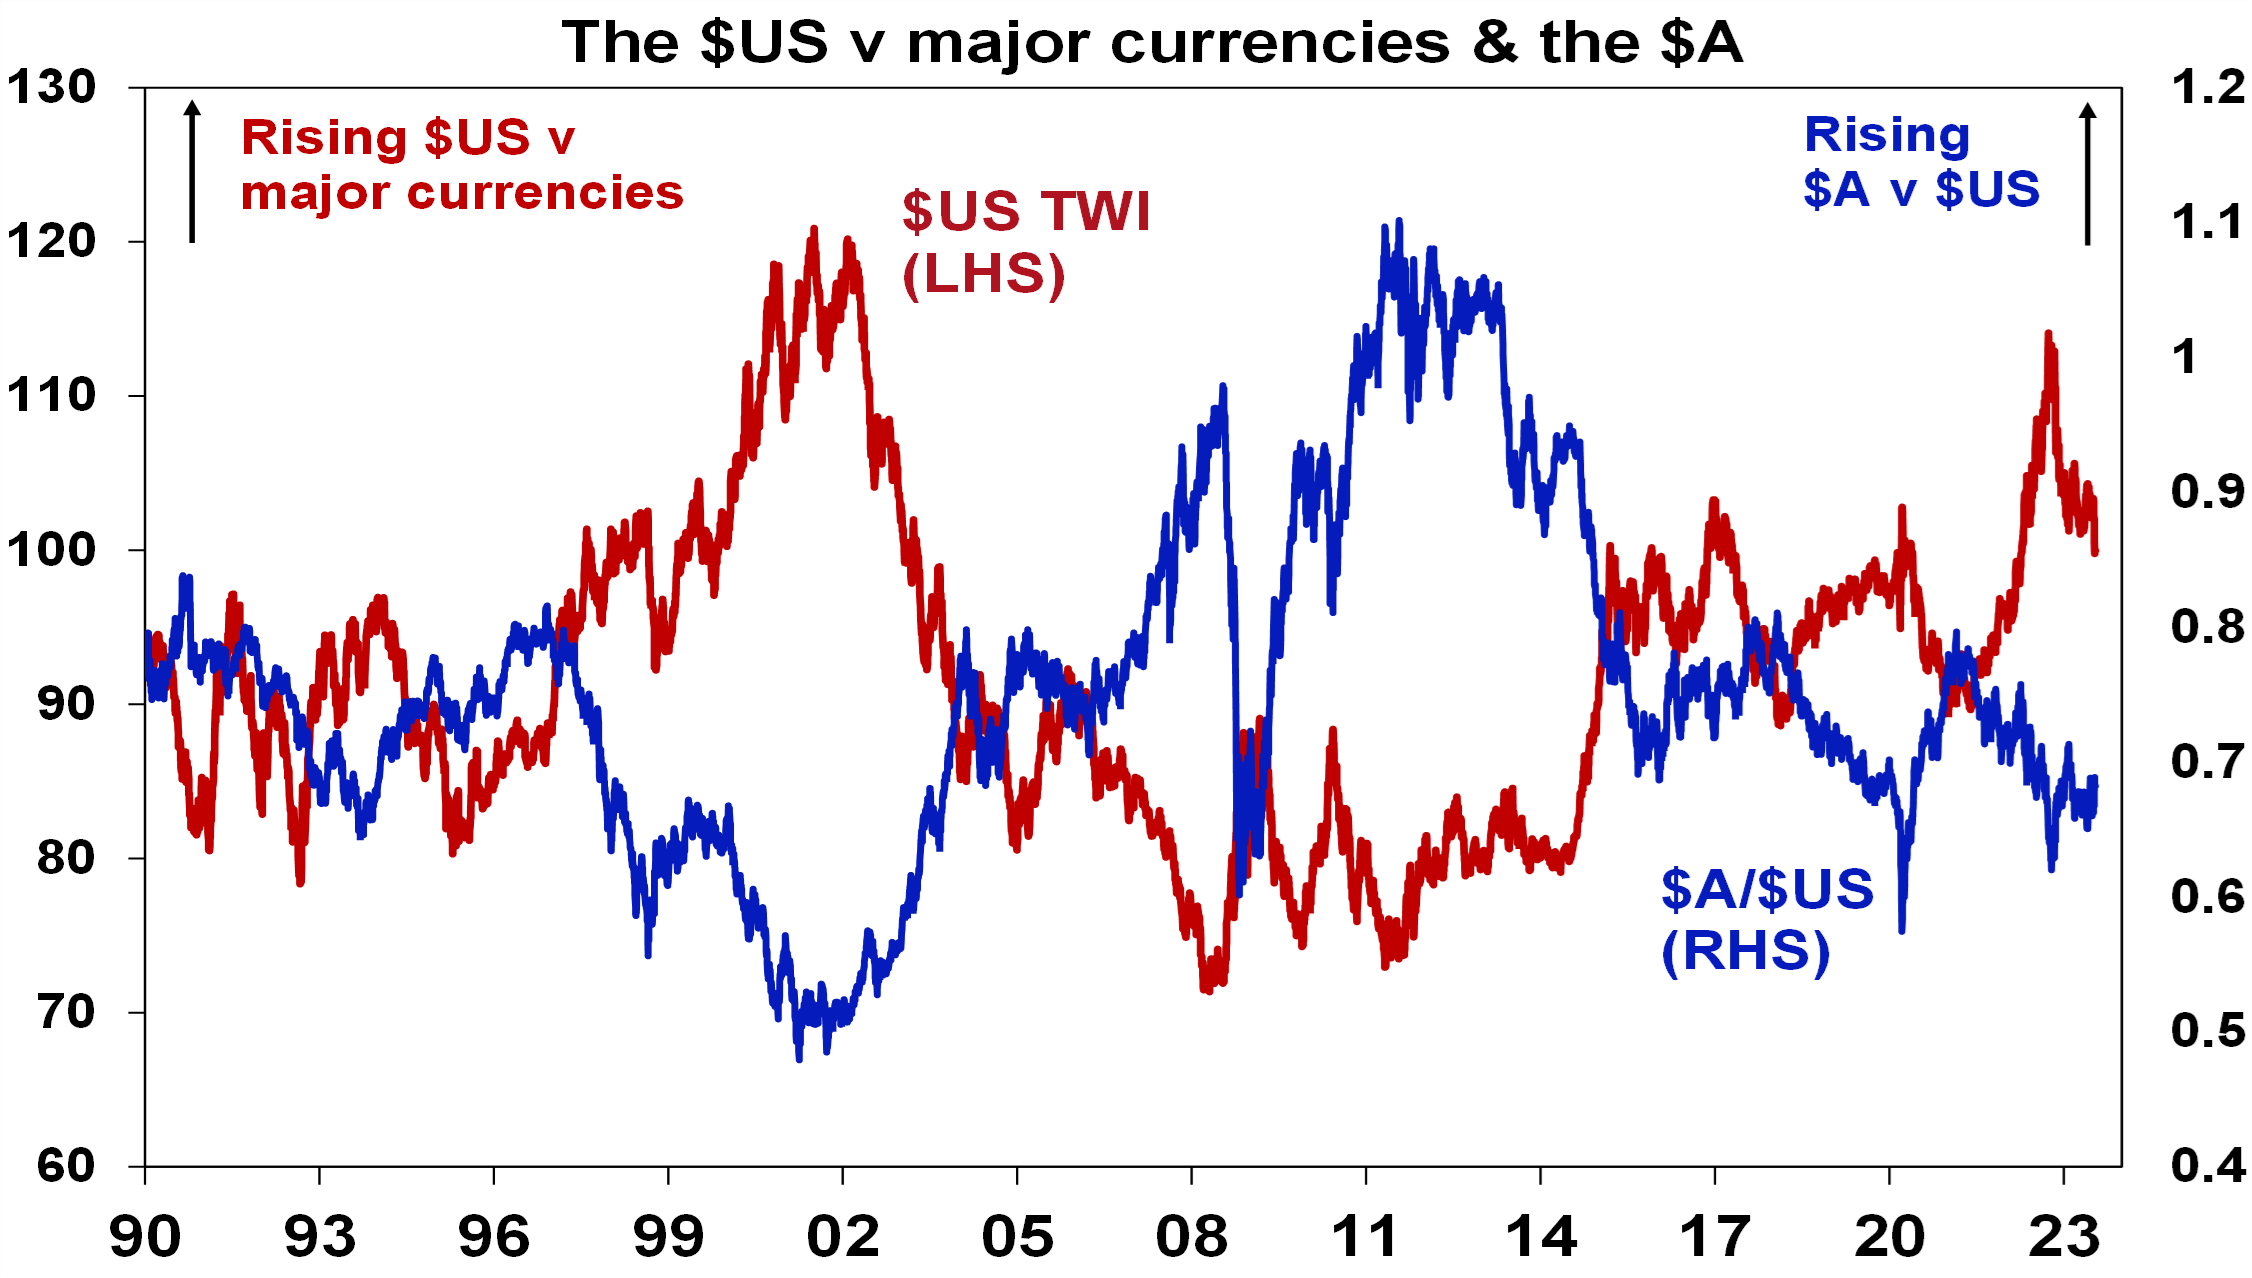
Chart 7 – the US dollar
Due to the relatively low exposure of the US economy to cyclical sectors (like manufacturing), the $US tends to be a “risk-off” currency. In other words, it goes up when there are worries about global growth and down when the outlook brightens. An increasing $US is also bad news for those with $US denominated debt in the emerging world. So, moves in it bear close watching as a key bellwether of the investment cycle. Last year the $US surged with safe haven demand in the face of worries about recession, war and aggressive Fed tightening. Since September though it has fallen back as inflation and Fed rate hike fears eased and geopolitical risks receded. And after stalling over the last six months, it’s since broken down again. A further downtrend in the $US would be a positive sign for investment markets this year, whereas a sustained new upswing would suggest they may be vulnerable. So far it’s going in the right direction.
Source: Bloomberg, AMP
Source: AMP
Three reasons to err on the side of optimism as an investor
By Robert Wright /December 01,2023/

Introduction
The “news” as presented to us has always had a negative bend, but one could be forgiven for thinking that it’s become even more negative with constant stories of disasters, conflict, wrongdoing, grievance and loss. Consistent with this it seems that the worry list for investors is more threatening and confusing. This was an issue prior to coronavirus – with trade wars, social polarisation, tensions with China, worries about job loss from automation and ever-present predictions of a new financial crisis. Since the pandemic higher public debt, inflation, geopolitical tensions and rising alarm about climate change have added to the worries. These risks can’t be ignored but it’s very easy to slip into a pessimistic perspective regarding the outlook. However, when it comes to investing the historical track record shows that succumbing too much to pessimism doesn’t pay.
Three reasons why worries might seem more worrying
Some might argue that since the GFC the world has become a more negative place and so gloominess or pessimism is justifiable. But given the events of the last century – ranging from far more deadly pandemics, the Great Depression, several major wars and revolutions, numerous recessions with high unemployment and financial panics – it’s doubtful that this is really the case viewed in the long term sweep of history.
There is no denying there are things to worry about at present – notably inflation, political polarisation, less rational policy making and geopolitical tensions – and that these may result in more constrained investment returns. But there is a psychological aspect to this combining with greater access to information and the rise of social media to magnify perceptions around worries. All of which may be adding to a sense of pessimism.
Firstly, our brains are wired in a way that makes us natural receptors of bad news. Humans tend to suffer from a behavioural trait known as “loss aversion” in that a loss in financial wealth is felt much more negatively than the positive impact of the same sized gain. This probably reflects the evolution of the human brain in the Pleistocene age when the key was to avoid being eaten by a sabre-toothed tiger or squashed by a woolly mammoth. This left the human brain hard wired to be on guard against threats and naturally risk averse. So, we are more predisposed to bad news stories as opposed to good. Consequently, bad news and doom and gloom find a more ready market than good news or balanced commentary as it appeals to our instinct to look for risks. Hence the old saying “bad news and pessimism sells”. This is particularly true as bad news shows up as more dramatic whereas good news tends to be incremental. Reports of a plane (or a share market) crash will be far more newsworthy (generating more clicks) than reports of less plane crashes this decade (or a gradual rise in the share market) ever will. As a result, prognosticators of gloom are more likely to be revered as deep thinkers than optimists. As English philosopher and economist John Stuart Mill noted “I have observed that not the man who hopes when others despair, but the man who despairs when others hope, is admired by a large class of persons as a sage.”
Secondly, we are now exposed to more information on everything, including our investments. We can now check facts, analyse things, sound informed easier than ever. But for the most part we have no way of weighing such information and no time to do so. So, it’s often noise. As Frank Zappa noted “Information is not knowledge, knowledge is not wisdom”. This comes with a cost for investors. If we don’t have a process to filter it and focus on what matters, we can suffer from information overload. This can be bad for investors as when faced with more (and often bad) news, we can freeze up and make the wrong decisions with our investments. Our natural “loss aversion” can combine with what is called the “recency bias” – that sees people give more weight to recent events in assessing the future – to see investors project recent bad news into the future and so sell after a fall. As famed investor Peter Lynch observed “Stock market news has gone from hard to find (in the 1970s and early 1980s), then easy to find (in the late 1980s), then hard to get away from”.
Thirdly, there has been an explosion in media competing for attention. We are now bombarded with economic and financial news and opinions with 24/7 coverage by multiple web sites, subscription services, finance updates, dedicated TV and online channels, chat rooms and social media. This has been magnified as everything is now measured with clicks – stories (and reporters) that generate less clicks don’t get a good look in. To get our attention, news needs to be entertaining and, following from our aversion to loss, in competing for our attention, dramatic bad news trumps incremental good news and balanced commentary. So naturally it seems the bad news is “badder” and the worries more worrying than ever which adds to a sense of gloom. The political environment has added to this with politicians more polarised and more willing to scare voters.
Google the words “the coming financial crisis” and it’s teeming with references – 270 million search results at present – and as you might expect many of the titles are alarming:
“A recession worse than 2008? How to survive and thrive”.
“Could working from home cause the next financial crisis?”
“Economic crash is inevitable”.
“Three men predicted the last financial crisis – what they’re warning of now is terrifying”.
“How China’s debt problem could trigger a financial crisis”.
People have always been making gloomy predictions of “inevitable” and “imminent” economic and/or financial disaster but prior to the information explosion and social media it was much harder to be regularly exposed to such disaster stories. The danger is that the combination of the ramp up in information and opinion, combined with our natural inclination to zoom in on negative news, is making us worse investors: more distracted, pessimistic, jittery and focused on the short term.
Three reasons to be optimistic as an investor
There are three good reasons to err on the side of optimism as an investor.
Firstly, without a degree of optimism there is not much point in investing. As the famed value investor, Benjamin Graham pointed out: “To be an investor you must be a believer in a better tomorrow”. If you don’t believe the bank will look after your deposits, that most borrowers will pay back their debts, that most companies will see rising profits over time supporting a return to investors, that properties will earn rents, etc. then there is no point investing. To be a successful investor you need to have a reasonably favourable view about the future.
Secondly, the history of share markets (and other growth assets like property) in developed, well managed countries, with a firm commitment to the rule of law, has been one of the triumph of optimists. Sure, share markets go through bear markets and often lengthy periods of weakness – where pessimists get their time in the sun – but the long term trend has been up, underpinned by the desire of humans to find better ways of doing things resulting in a real growth in living standards. This is indicated in the next chart which tracks the value of $1 invested in Australian shares, bonds and cash since 1900 with dividends and interest reinvested along the way. Cash is safe and so fine if you are pessimistic but has low returns, and that $1 will have only grown to $250 today. Bonds are better, and that $1 will have grown to $903. Shares are volatile (and so have rough periods – see the arrows) but if you can look through that, they will grow your wealth and that $1 will have grown to $811,079.

Source: ASX, Bloomberg, RBA, AMP
This does not mean blind optimism where you get sucked in with the crowd when it becomes euphoric or into every new whiz bang investment obsession that comes along (like bitcoin or the dot com stocks of the 1990s). If an investment looks too good to be true and the crowd is piling in, then it probably is – particularly if the main reason you are buying in is because of huge recent gains. So, the key is cautious, not blind, optimism.
Finally, even when it might pay to be pessimistic and hence out of the market in corrections and bear markets, trying to get the timing right can be very hard. In hindsight many downswings in markets like the GFC look inevitable and hence forecastable, and so it’s natural to think you can anticipate downswings going forward. But trying to time the market – in terms of both getting out ahead of the fall and back in for the recovery – is difficult. A good way to demonstrate this is with a comparison of returns if an investor is fully invested in shares versus missing out on the best (or worst) days. The next chart shows that if you were fully invested in Australian shares from January 1995, you would have returned 9.3% pa (with dividends but not allowing for franking credits, tax and fees).

Covers Jan 1995 to March 2023. Source: Bloomberg, AMP
If you were pessimistic about the outlook and managed to avoid the 10 worst days (yellow bars), you would have boosted your return to 12.2% pa. And if you avoided the 40 worst days, it would have been boosted to 17.1% pa! But this is very hard, and many investors only get really pessimistic and get out after the bad returns have occurred, just in time to miss some of the best days. For example, if by trying to time the market you miss the 10 best days (blue bars), the return falls to 7.2% pa. If you miss the 40 best days, it drops to just 3% pa.
As Peter Lynch has pointed out “More money has been lost trying to anticipate and protect from corrections than actually in them”.
On a day to day basis it’s around 50/50 as to whether shares will be up or down, but since 1900, shares in the US have had positive returns around seven years out of ten and in Australia it’s around eight years out of ten.

Daily and monthly data from 1995, data for years and decades from 1900. Source: ASX, Bloomberg, AMP
So, getting too hung up in pessimism on the next crisis that will, on the basis of history, drive the market down in two or three years out of ten may mean that you end up missing out on the seven or eight years out of ten when the share market rises. Here’s one final quote to end on.
“No pessimist ever discovered the secrets of the stars, or sailed to an uncharted land, or opened a new heaven to the human spirit”.
– Helen Keller
Source: AMP
Super fund performance and unlisted assets
By Robert Wright /December 01,2023/

Differences in the returns of various super funds have primarily been driven by whether the funds are invested in unlisted or listed assets.
Super fund returns are always in the spotlight around the end of the financial year. This is when funds publish their annual performance results and send statements to members, and when researchers publish tables comparing fund returns.
Going forward, fund members may notice a wider than usual gap between the performances of various super funds.
A large part of the difference in returns this year comes down to whether – and how much – super funds have invested in unlisted assets.
In recent years, super funds have been under pressure due to their practices around “lumpy” revaluations for unlisted assets concerning the quality, accuracy and frequency of revaluing unlisted assets.
Millions of super members are in the dark about these practices – and therefore about how much their investment is really worth.
In July 2022, the Australian Prudential Regulation Authority (APRA) released final revisions on Prudential Standard SPS 530, Investment Governance to ensure better member outcomes through updated requirements that increase stress-testing, valuation and liquidity management practices.
The enhancements to strengthening investment governance have been in effect from January this year.
What are unlisted assets?
Unlisted assets are investments that are not traded through a public exchange or market, such as the Australian Securities Exchange (ASX) or the New York Stock Exchange (NYSE).
Investors in unlisted assets can either directly own the asset or invest with others through an unlisted trust.
The most common types of unlisted assets are:
- Unlisted property – from small property syndicates with assets such as neighbourhood shopping centres to multi-billion-dollar unlisted property trusts which own major CBD office buildings, large shopping centres or hotels.
- Unlisted infrastructure – development or ownership of roads, rail, ports, airports and utilities.
- Private equity – invest in or own private companies, including early stage investments in technology companies.
- Private credit – involves lending to privately owned businesses.
What are listed assets?
Listed assets are those that are traded on a stock exchange or share market, such as the ASX or NYSE.
The most common type of listed asset is shares, also known as equities.
Other listed assets include:
- Listed property – offers the ability to invest in a diverse portfolio of large properties through an Australian real estate investment trust or real estate investment trust on an international share market.
- Listed infrastructure trusts – trusts that invest in major infrastructure e.g. roads, rail and airports.
- Bonds – issued by a company or government to raise money which constitute a loan from an investor.
- Exchange traded funds (ETFs) – collection of assets that track the performance of a major investment index e.g. the S&P 500 Index.
- Managed funds – money from a number of investors which is pooled to buy investments.
How are unlisted and listed assets valued?
The difference in how unlisted and listed assets are valued is what affects super fund returns at any given time.
Timing of valuation
- Unlisted assets are typically valued at set intervals. For example, quarterly or annually.
- Listed assets are valued every day. Investors decide daily how much they are willing to pay for shares in the company or trust.
Method of valuation
- Valuations of unlisted assets are often made using historical or point-in-time factors. For example, unlisted property valuations are partly based on past sales of similar properties, which may have been completed when market conditions were different. As a result, values for unlisted assets are often different for the same asset in a listed market.
- Listed assets are valued by investors in an organised, open and transparent market. Valuations are an accurate, up to the minute reflection of what willing buyers and sellers in a market will pay.
Continued criticism is that valuations arranged by asset owners could lead to biased results if asset owners judge the value of their own investments too generously.
How does valuation timing impact your super’s performance?
The difference in valuation timing means changes in economic, competitive and market conditions are reflected in the value of listed assets more rapidly than unlisted assets. Therefore, listed asset values are affected more in the short term by market ups and downs versus unlisted assets.
Over the past months, central banks globally have sharply increased their interest rates in response to inflation. Rises in global and Australian interest rates have been quickly factored into prices for assets listed on stock exchanges. The result was an immediate fall in prices and losses for investors.
However, these significant changes may not yet be reflected in the valuations of unlisted assets.
Add to this the fluctuations in unlisted infrastructure and unlisted property funds, which many super funds are directly invested in, and the valuation of unlisted assets becomes a bigger issue.
Essentially, the difference in performance lowers returns in super funds, especially those holding mainly listed property, while funds holding mainly unlisted property have not yet been affected.
However, as unlisted property trusts go through their valuation cycles, downward returns are expected to be reported in those trusts, due to the significant devaluation risks in the higher interest rate environment.
Why is liquidity in super funds important?
Super is a long term investment and while you are accumulating your retirement savings, you may not need regular access to your money. However, super funds do need the flexibility to buy and sell investments to manage risk, respond to market conditions and take advantage of opportunities that arise.
Super funds also need to maintain liquidity to meet the redemptions of retiring investors, so the liquidity of investments is crucial at a fund level.
Source: Colonial First State
Understanding market volatility
By Robert Wright /December 01,2023/

Many investors become concerned when volatility occurs in global financial markets – particularly about the impact on their superannuation and other investments. In times like these, it’s important to understand the causes of market movements and how to minimise your risk.
Why do markets move so much?
Markets are influenced by many things – industrial, economic, political and social factors can all have an impact. For example, consumer and business confidence affect spending and therefore company profits.
Global trade and production naturally affect economic growth. Poor political and fiscal decisions in some countries may lead to a flow on effect in other countries who are owed money. And of course, natural disasters can cause major damage to any economy with no warning.
During times of market volatility, it’s important to remember one of the fundamental principles of investing – markets move in cycles.
What is the effect of market volatility on super funds?
In times of market volatility your super balance may decline but it is important to remember that markets move in cycles. Volatility is a natural part of the economic cycle. Markets are influenced by a range of factors and are inherently unpredictable.
The Australian Securities & Investments Commission (ASIC) states that, ‘negative returns from time to time are not inconsistent with successful long term investment’. History demonstrates that over the long term, the general trend of share markets has been upward.
Don’t lose sight of the bigger picture
Super is a long term investment. Shares, which usually form a large part of most balanced super accounts, are also generally a long term investment. They are designed to provide capital growth over a period of five years or more. Think in years, not days.
The time frame for super may be 20 years or more, so short term volatility shouldn’t diminish the long term potential of your investments. Growth assets (such as shares) tend to fluctuate in the short term but have historically provided excellent returns for investors over the long term.
When share markets fall in value, it may be tempting to sell up. However, trying to time the market by selling now and buying back later is a risky strategy that rarely results in investors coming out ahead. By taking a long term view of investing, you can ride out any short term fluctuations in the market and take advantage of growth opportunities over the long term.
Diversification
Diversification is one of the most effective ways of managing volatility. It can help deliver smoother, more consistent results over time. Your investment may benefit by being spread across a variety of asset classes, including shares (domestic and global), fixed income, cash, direct and listed property and alternatives.
This diversification should help soften the effects of any share market falls as some asset classes often tend to do well whilst others are struggling. Also, spreading your assets around means you are less reliant on any one asset class at any particular time.
Understand your risk profile
All investments carry some risk. How much risk you’re willing to accept will be influenced by your financial situation, family considerations, time horizon and even your personality. If market volatility has caused you to reassess the way you feel about risk, it’s important that you see your financial adviser to discuss any necessary changes to your financial plan.
Understanding the implications of withdrawing
Before you withdraw from an investment you should understand all the implications, risks and costs involved.
Locking in your losses. If the value of your investment is falling, you are technically only making a loss on paper. A rise in prices could soon return your investment to profit without you doing anything. Selling your investment makes any losses real and irreversible.
Incurring capital gains tax (CGT). Make sure you know what your CGT position will be before selling any asset.
Losing the benefits of compounding. If you’re thinking about making a partial withdrawal from an investment, remember that it’s not just the withdrawal you lose but all future earnings and interest on that amount.
Key takeaways
Keep in mind that:
- Super is a long term investment designed to generate sufficient money so you can enjoy your retirement.
- Diversification is an important part of a long term super investment strategy. To create the lifestyle you want in retirement, it may be necessary to invest in growth assets like shares so that your returns stay ahead of tax and inflation.
- It may be beneficial to ride out the bad times in order to achieve long term growth.
Your financial plan was designed exclusively for you to suit your investment objectives and risk profile. It’s important to stay focused on your long term goals.
Source: Colonial First State