
Tag Archives: Cash flow
Protecting retirement income from inflation
By Robert Wright /August 22,2025/

The fall in inflation from multi decade highs is good news for the Australian economy. Many retirees are struggling to manage their cost of living because of the cumulative impact inflation has had on their financial position.
Looking forward, retirees need a portfolio that is protected from inflation risks so that they don’t experience another cost of living crisis when inflation has another upturn.
Maintaining the long-term real value of investments
The key to a successful investment strategy is the ability to generate returns over the long term. Managing inflation is an important piece of the strategy. Long-term investments need to be able to generate a real rate of return that provides growth in the investment value. The investments do not need to capture short-term inflation changes, but they need to offset the impact of inflation over time. Assets that are expected to do this are generally referred to as ‘growth’ assets. To demonstrate this, we can look at the historical performance of assets over the long run1. Looking at Australian investment returns between 1900 – 2023, equities provided a return higher than inflation in 81 years which was 73% of the time. The one-year success rate for bonds and bills (cash) were lower, constrained by historical limits on bond yields. Both bonds and bills provided a one-year real return only 62% of the time in the same period.
The long run probabilities are shown in Figure 1. As the investment horizon extends out, up to 25 years, the probability of equities providing a real return increases. The higher returns on the investment eventually overcome any initial shortfall. Bond and bill investments show little improvement with a longer investment horizon2. At horizons of 20 years, the probability of delivering a positive real return from nominal bonds was only 60%. Historically, all investment horizons of 16 years (and longer) have provided a positive real return for Australian equities. While history does not provide a guarantee, the increase shown in Figure 1 should provide confidence that a long-term investment in equities will provide real capital growth. This analysis can be extended to diversified products such as a 70/30 growth fund (70% equities and 30% bonds) and a 50/50 balanced fund (50% equities and 50% bonds). These both show trend improvements over time, benefiting from the exposure to growth assets, but over longer periods. The 70/30 fund needed 20 years and the 50/50 fund 25 years historically to ensure the positive real return.
The portfolio comparison in retirement is important in the generation of income over longer periods. If income is taken as a set percentage of the balance than changes in income will directly link to market movements. Also, there are market linked annuities available in Australia where the capital is consumed but the income, which is paid for life, will be directly linked to the performance of the specified market or underlying investments. This paper provides a historical basis to consider the inflation protection provided by these income streams. Historical investment performance is not a reliable indicator of future performance, but it is worth considering the timeframe for recovery from historical shocks.
Figure 1: Historical probability of positive real returns, 1900-2023
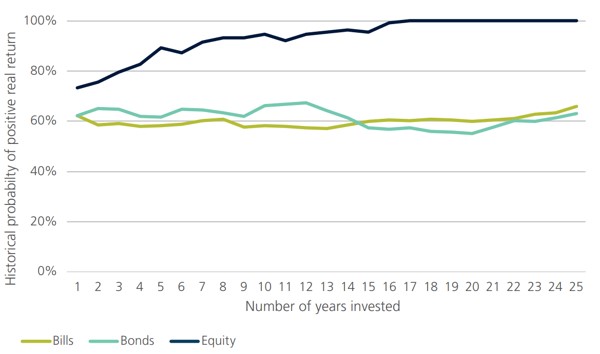
Source: Calculations, based on data from Morningstar, S&P, Bloomberg and ABS
Inflation risk in retirement
Inflation is often called out as a risk in retirement that needs to be managed differently. Longevity and sequencing risks are also noted as being different, and these are not present in the accumulation phase. One of the challenges with managing inflation risk in retirement, is that inflation risk has a different impact on a portfolio in the retirement phase. Management of inflation risk in retirement needs a different approach. It is not just that capital needs to regain its real value, but every income payment needs to keep its value to maintain the target lifestyle of the retiree.
We can examine this difference by considering the outcome for someone who started to draw an income at the start of 1973. This was one of the worst years in the historical comparison where the inflation spike meant that any investment linked income would be falling in real terms in the first year. If a retiree’s income was linked to an investment, the real value would have declined for any of the three assets: Bills by 3.5%; Bonds by 26% and Equities by 30.7%. What happens over time is the recovery in the level of income. Income linked to equity performance briefly exceeds the original value in 1980 but dips again before maintaining real gains from 1983. Bills provide higher real income from 1985 while bonds will take until 1992. The 19 year impact on bonds highlights the exposure that nominal bonds have to inflation risks. The pattern for income linked to the different markets from 1973 can be seen in Figure 2.
Figure 2: Investment-linked income example
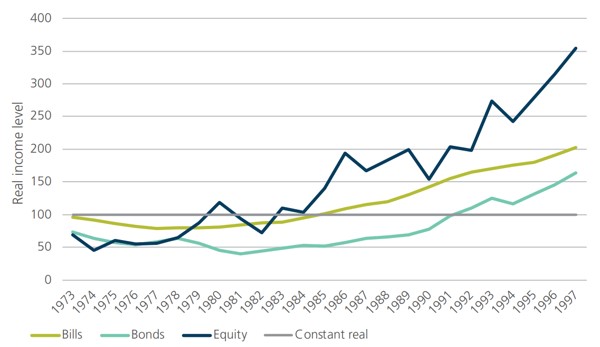
Source: Calculations, based on data from Morningstar, S&P, Bloomberg and ABS
There is more at stake for retirees. The impact is not just the length of time to recover the real capital value, but the income that is lost over that period. For the nine years that the real equity linked income is under the starting point, a retiree needs to reduce their lifestyle or run their capital down early. The shortfall is shown in Figure 3. It highlights the cumulative shortfall in income, relative to the initial lifestyle of the retiree. The starting point is where inflation risk creates an impact which might be after the start of retirement.
The shortfall highlights the extent of the impact from an inflation shock. The worst performance is from bonds, where more than 7 years of income (lifestyle) were lost over a 17-year period before a modest recovery. For equity-linked income, nearly three years of lifestyle were lost over nine years. While there was a strong recovery after, this is an average of a third of total spending that needs to be cut for an extended period. Cash investments took longer to fully recover, but the extent of the pain was not as large. The worst point is ten years after the shock, where the retiree has missed 1.7 years of real spending.
Figure 3: Cumulative shortfall in real incomes
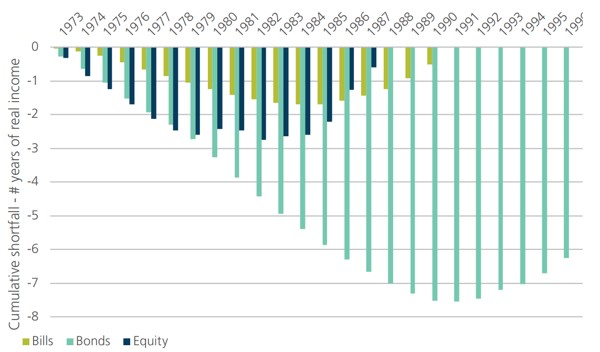
Source: Challenger calculations, based on data from Morningstar, S&P, Bloomberg and ABS
The extended pain highlights why inflation risk is an additional risk to consider in retirement. It is not just the capital recovery, but it is the lost lifestyle that happens when an income stream does not keep pace with inflation. Retirees that choose a market linked income stream need to have the capacity to sustain a potential extended period of reduced lifestyle before they can enjoy an increased lifestyle later in retirement.
Payment profiles and income indexation
The analysis so far has highlighted how inflation shocks can impact a lifestyle based on an initial spending level. In practice, not all spending profiles are the same. The different approaches to generating income provide differing levels of starting income. Some differing options for indexation of an income stream include:
- CPI linked lifetime income
- Market linked lifetime income3
- Accelerated payments with market-linked lifetime income
A CPI linked lifetime income stream sustains the lifestyle of the retiree by adjusting their payments with changes in the cost of living. A market linked income stream uses an indirect approach, that requires market movements to exceed CPI inflation over time to maintain the lifestyle of the retiree. Accelerated payments are designed to smooth the income profile of market linked income streams. Recognising that payments are expected to grow over time, some of the income can be front-loaded by indexing the payments by a fixed percentage lower than the market return. This provides a higher starting payment that will grow more slowly. This fixed percentage is sometimes called the assumed investment rate (AIR). The analysis includes payments for an AIR of 2.5% p.a. and 5% p.a. The difference in the initial payment rates as shown in Figure 4 can be substantial.
Figure 4: Initial payment rates
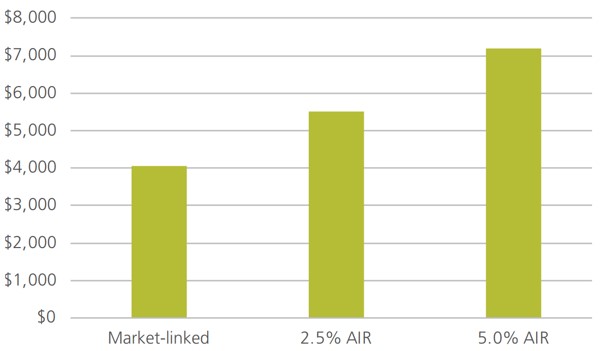
Source: Challenger, as at 8 April 2024
Current rates provide a range of starting payments, per $100,000 of around $4,000 to $7,000 a year, for a 65 year old male. A market-linked lifetime annuity with a 5% AIR has payments starting at a rate 78% higher than one with no AIR. Over time the payments will increase by 5% less each year so over time the payments will cross over. This wedge is independent of market movements.
The paths for the 30 years from Dec 1993 to Dec 2023 can be seen in Figure 5. This shows the five-fold increase for payments that were linked to the accumulation performance of the S&P/ASX200 over that time. The 5% AIR hurdle provided the highest initial payment, but lower indexation meant that this would not have been the highest after 2004, only 11 years into retirement. The smaller increase in the payments with a 5% AIR would not have kept up with inflation from the initial payment level. It provided a flatter spending profile that declines in real terms.
Figure 5: Market-linked payments over time
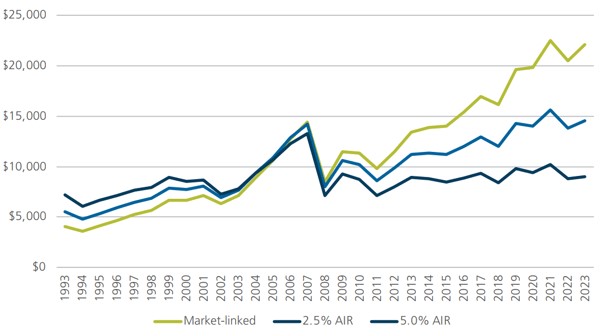
Source: Challenger, S&PASX200
Dividend strategy
Another approach with an equity investment is to use only the dividend payments for retirement income. Dividend yields tend to be counter cyclical so dividends are not as volatile as share prices. The question is how well they keep up with inflation over time. Again, we can use the available historical data4 to see what might have happened. One difference is that none of the dividends are reinvested. When dividends are higher, a market linked strategy effectively reinvests the excess. A dividend strategy spends this excess which has an impact over longer horizons.
Another difference with a dividend strategy is the starting income levels. The starting income reflects the dividend yield available at the time, with no consumption of capital over time. The first challenge is to see if the dividends protect from inflation for the given starting level. Figure 6 highlights how the dividend strategy does not provide the same level of protection of an equity market-linked strategy. It begins with a 60% success rate, similar to the equities market linked strategy with a 5% AIR. Over time, the success rate improves, but it does not match an equity market linked strategy. Historically, dividend growth over 25 years was below inflation in 10% of the scenarios. The earliest in this sample was 1929-1954 and the latest was 1969-1994.
Figure 6: Inflation protection of a dividend strategy
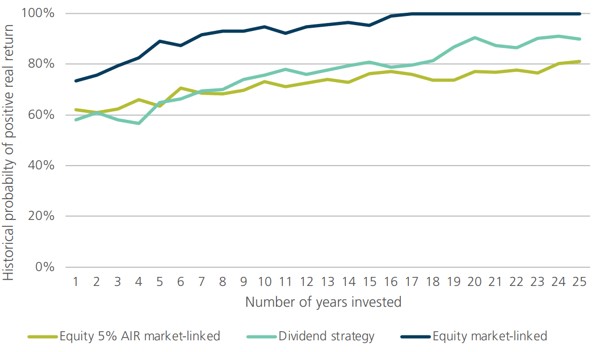
Source: Challenger calculations, based on data from Morningstar, S&P, BHM, Bloomberg and ABS
The dividend strategy maintains the capital invested in the underlying equities so the income payments will be lower than what can be achieved if the capital is consumed over retirement. On average, the dividend yield has been 4.65% p.a. and is currently 5.2% including franking credits. Investors might expect inflation protection similar to an equity linked 5% AIR investment. In practice, the initial income is lower with a dividend strategy, but the lower income is better protected than the 5% AIR strategy. However, it can take a long time to catch up the initial income gap.
Another impact of maintaining the capital is that the dividend strategy does not increase payments at older ages. The comparison to market linked lifetime income streams is shown in Figure 7 which shows that only the market-linked strategy with a 5% AIR has a higher initial payment at age 65, but by age 75, the dividend strategy provides lower payments than any of the other strategies. This demonstrates that a dividend strategy supports a lower lifestyle than a strategy that will consume capital over time. Retirees are unable to maximise the money available to spend through retirement if they do not draw down on their capital.
Figure 7: Initial payment rates per $100,000 investment at different ages
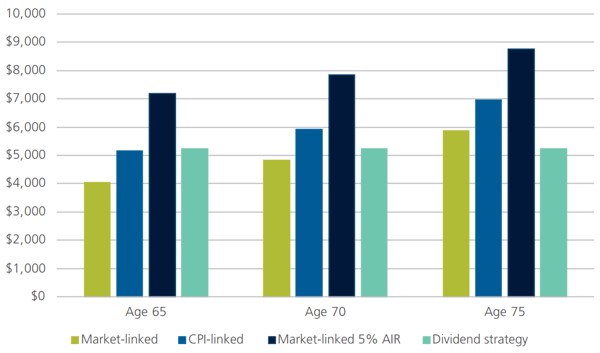
Source: Challenger as at 8 April 2024 with calculations based on S&P data as at Dec 2023
Age Pension
Another consideration for retirees thinking about inflation protection is their entitlement to the Age Pension. Around two in three current retirees receive at least a partial Age Pension, and while this is likely to decline, a significant proportion of retirees will continue to receive some Age Pension in the future. The Age Pension provides an income stream that automatically increases with inflation. Over time, it will also increase with real wages growth, but the real wage declines in recent years mean that it is probably still several more years until the Age Pension will increase more than inflation. The mechanics of the Age Pension indexation can result in retirees receiving a partial Age Pension being over compensated. The full Age Pension payment is indexed and any means tested amounts are calculated relative to the new full payment. While earned income is likely to increase with inflation, the assets held by an asset tested pensioner might increase by less than inflation, or even fall. In this case, the proportionate increase in Age Pension payments might be higher than inflation reducing the need to fully protect a retirement portfolio from inflation. This protection is provided only up to the value of the Age Pension. If a retiree has any lifestyle requirements above the safety net provided by the Age Pension they need to be fully protected against inflation.
Conclusion
Protecting an investment portfolio from inflation can be an important concern for any investor. In retirement, the challenge increases as a retiree needs to protect their income stream to be able to sustain their lifestyle. While some investments can protect against inflation over the long run, market linked investments don’t necessarily protect an income stream from inflation over the short to medium term. Retirees who want to be able to maintain their lifestyle need the inflation protection that can be provided by a CPI linked income stream. The Age Pension will deliver some of this for retirees, but those with a lifestyle goal above the Age Pension’s safety net will need an additional source of inflation protected income.
1 The historical data in this paper comes from the Dimson, Marsh and Staunton dataset as provided by Morningstar. Recent data on indices relates to the S&P/ASX 200 Accumulation index, Bloomberg AusBond Composite 0+Yr Index and Bloomberg AusBond Bank Bill Index. Recent inflation data is the CPI sourced from the Australian Bureau of Statistics.
2 The majority of these periods were between 1933 and 1973 when bond yields were set by regulation.
3 Different market-linked options are available, but the initial payment is the same for each option.
4 Historical data is calculated as the difference between Accumulation and price returns in the BHM dataset: Brailsford, T., J. Handley & K. Maheswaran (2012) The historical equity risk premium in Australia: Post GFC and 128 years of data. Accounting and Finance Vol52.1 pp237-247. Franking credits have been included for the period post 1987
Source: Challenger
Reserve Bank cuts interest rates by 0.25 percentage points in August in unanimous decision
By Robert Wright /August 22,2025/

In short:
The Reserve Bank cut interest rates by 0.25 percentage points in August to 3.6 per cent, after July’s shock ‘on hold’ decision.
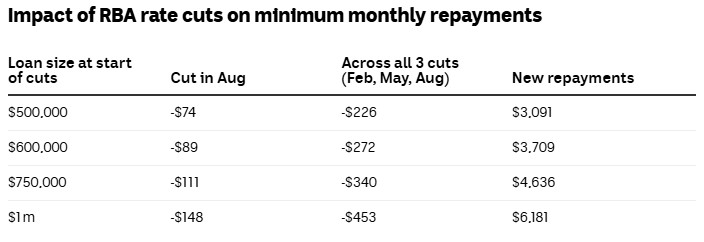
The average owner-occupier with a $750,000 mortgage as of February will see their minimum monthly repayment fall $111 if their bank passes on the cut, taking the cumulative reduction this year to $340, according to Canstar.
What’s next?
The next RBA rates decision will be delivered on September 30. After that, there are two further meetings this year, in November and December.
The Reserve Bank has delivered its third interest rate cut of 2025, with a 0.25 percentage point reduction at its August board meeting.
That takes the cash rate to 3.6 per cent for the first time since April 2023.
The move had been overwhelmingly anticipated by financial markets and economists after the surprise decision to hold rates steady in July.
It was a unanimous decision by board, which had been divided last month.
Tuesday’s cut follows a further easing of inflation in the June quarter, which RBA governor Michele Bullock last month highlighted as the crucial piece of data the monetary policy board was waiting for.
“Updated staff forecasts for the August meeting suggest that underlying inflation will continue to moderate to around the midpoint of the 2–3 per cent range, with the cash rate assumed to follow a gradual easing path”, the post-meeting statement read.
ABC News / Source: Reserve Bank of Australia
The inflation pull back, alongside “labour market conditions easing slightly, as expected”, led the board to deem “further easing of monetary policy was appropriate”.
“This takes the decline in the cash rate since the beginning of the year to 75 basis points”, the RBA board noted in its statement.
The central bank cut interest rates at its February and May board meetings.
Before that, the RBA’s cash rate had sat at 4.35 per cent since November 2023, after a series of 13 rate hikes, beginning in May 2022.
Treasurer Jim Chalmers described it as a “very welcome relief for millions of Australians”.
“It means the lowest interest rates for more than two years”, he said shortly after the decision.
“It reflects the substantial and sustained progress we’ve made on inflation in a volatile and uncertain global environment”, the treasurer noted in a statement.
Cash rate at 3.6pc, further rate cuts expected
The Australian dollar fell following the decision, dipping just below 65 US cents as Ms Bullock addressed a media conference in Sydney.
The RBA governor indicated the board was prepared to cut interest rates further if necessary.
“The forecasts imply that the cash rate might need to be a bit lower than it is today to keep inflation low and stable, and employment growing, but there is still a lot of uncertainty”, Ms Bullock told reporters.
“The board will continue to focus on the data to guide its policy response”.
Where are rates heading?
The Reserve Bank’s economic outlook suggests further room to cut interest rates, but it’s not all good news for most working-age Australians.
Betashares chief economist, David Bassanese has forecast further interest rate cuts, with the next easing more likely in November, rather than at the next meeting in September.
“Indeed, the [central] bank’s own forecasts of underlying inflation stabilising at 2.6 per cent over coming quarters incorporate further declines in the cash rate in line with current market expectations”, he wrote.
“That said, barring a major growth scare, the RBA does not seem in any rush to cut interest rates.
“All up, my base case remains that a rate cut on Melbourne Cup day is an odds on favourite –following release of the June quarter consumer price index report in late October”.
The governor would not be drawn on what specific cash rate the central bank considers to be “neutral” – that is, the level where the rate is not stimulating or putting a handbrake on the economy.
Instead, she gave a “very wide range” of between 1 and 4 per cent, and noted a neutral rate is for when there is an absence of economic shocks.
“We are very often not in the absence of shocks … we’ve got shocks, particularly at the moment”.
While the central bank’s forecasts put inflation around target over the period ahead, it has downgraded its growth forecasts.
It now expects gross domestic product (GDP) expanded 1.6 per cent over the year to June (compared to 1.8 per cent forecast in May); and GDP growth to only pick up to 1.7 per cent by the end of the year (it had previously forecast 2.1 per cent).
“Its forecasts assume that the cash rate will continue to ‘follow a gradual easing path’, implying that without further easing growth and inflation will be lower and unemployment higher”, AMP chief economist, Shane Oliver said.
AMP has forecast further rate cuts in November, February and May to take the cash rate to 2.85 per cent.
“We continue to see further rate cuts as growth remains sub par, the risks to unemployment are on the upside, underlying inflation is likely to remain around the 2.5 per cent target and monetary policy remains tight”, Dr Oliver wrote.
How much will home loan repayments fall?
Some lenders were quick off the mark to confirm they would be passing on the interest rate cut to home loan customers, with Macquarie, Commonwealth Bank, Westpac, ANZ, NAB and AMP among the first handful of announcements.
The cumulative effect of three rate cuts so far this year have added up to a substantial reduction in minimum mortgage repayments for many home loan borrowers.
According to calculations by financial comparison site Canstar, the savings from this month’s cut range from $74 on a half a million dollar mortgage, to $148 on a $1 million home loan.
Based on an owner-occupier paying principal and interest with 25 years remaining in Feb 2025 at the RBA average existing customer variable rate. Calculations assume the banks pass on each cut in full to existing variable customers the month after.
Source: Canstar.com.au
The numbers are based on an owner-occupier repaying principal and interest, who had 25 years remaining on their loan in February.
The estimates assume borrowers were paying the average variable rate of 5.79 per cent, which would fall to 5.54 per cent after Tuesday’s 0.25 percentage point cut, and that lenders pass on cuts in full to existing variable customers the following month.
Home loan borrowers are not obliged to lower repayments, and, in fact, most do not – last month, Commonwealth Bank released data showing only one in 10 eligible home loan customers reduced their mortgage direct debits after the rate cut in May.
If borrowers continue to make repayments above the minimum required, they will pay down more of the principal as the interest reduces, and pay off their loan faster.
Source: ABC News
Using the bucket strategy to make your money last longer
By Robert Wright /February 28,2025/

How do you find the sweet spot between using your retirement savings to enjoy a comfortable standard of living, and investing so you won’t run out of money in the future? It’s a big question for many retirees.
Two in three retirees (69%) are concerned about running out of money in retirement, according to new research from Colonial First State (CFS)*.
A total of 41% said they sometimes felt so concerned about running out of money that it affected how they used their retirement savings and their current standard of living. A further 28% said this fear affected them significantly. Just one in three said they never worried about it.
With that in mind, it’s worth understanding what’s known as the ‘bucket strategy’ for how to manage your savings in retirement.
This strategy was conceived as a way for retirees to balance spending with the need to preserve capital and invest to grow your future retirement savings to last the distance.
How much you put into each bucket, and how you invest those buckets will depend on your level of retirement savings, the lifestyle you want in retirement, your risk appetite and any other income you may have. It’s worth getting financial advice to ensure this approach is right for you.
What is the bucket strategy?
Simply put, the bucket strategy involves keeping your money in different investment types designed to deliver short term, medium term and long term returns.
- Short term bucket: This is money you think you’ll need to access in the next one to three years. Consider keeping it in cash, such as high yield savings accounts or term deposits with staggered maturity dates.
This is money to live on and perhaps an emergency fund for those unexpected expenses, such as when your washing machine stops working or your car conks out.
There should be enough to get you through a market downturn if needed, so you don’t need to cash in higher growth investments and turn paper losses into real ones or sell units in your pension investment option when they may have experienced a short term drop in value.
Factor in any other income, such as the Age Pension if you receive it, or any work income, and set aside money to cover the rest.
- Medium term bucket: Consider holding money you may need in the next four to six years in income producing, relatively ‘safe’ assets like high quality bonds, fixed income investments, low risk, dividend paying stocks or a balanced pension investment option.
This bucket is designed to help your retirement savings keep pace with inflation. If you hold too much in cash, your retirement savings won’t grow very quickly.
- Long term bucket: This is the money you want to invest to grow over the long term. It can be kept in higher growth investment types that are often seen as higher risk, such as a growth pension investment option or growth shares.
This should be money you won’t need to touch for seven to 10 years, which gives it time to grow irrespective of any short term market volatility that may occur.
More than half your retirement savings may be generated from earnings on your pension investment option after you have retired^, so it’s worth quarantining a good amount in your long term bucket.
How does it work?
The bucket strategy is intended to balance the need to preserve your capital in retirement by putting some of your savings into low risk cash options.
This enables retirees to access income when you need it without dipping into higher growth investments that will grow your retirement savings over the long term and can therefore provide peace of mind about spending while also helping your retirement savings last longer.
It can be particularly beneficial in times of market volatility, such as if there is a market downturn, to prevent you having to sell higher risk investments at an inopportune time.
Keeping all your retirement savings in conservative investment options or cash that may not keep pace with inflation may be low risk but it won’t provide you with the best retirement outcomes over the long term.
As the funds in bucket 1 are used, consider topping it up from bucket 2, or even bucket 3, depending on market conditions, what you’re invested in, and how your investments are performing.
As mentioned, how much you put into each bucket, and how you invest those buckets will differ depending on your individual situation. It’s worth getting financial advice to ensure this approach is right for you.
And this strategy may require more active management of your retirement savings than some people may be comfortable with.
But the bucket strategy offers built in diversification by incorporating different investment types and time frames and can be useful for helping you decide how much to spend and how much to invest for the long term.
* Financial literacy and retirement study conducted between July and September 2024. Respondents included 834 retiree respondents.
^ Calculations by CFS. Projection starts at age 25 (with salary of $100,000), retirement at age 65 and super lasts until age 92. Superannuation earnings, tax on earnings, investment and administration fees, and yearly indexation of contributions and income stream payments, are based on the default assumptions used in ASIC’s Moneysmart calculator, available at moneysmart.gov.au as at August 2024.
Source: CFS
What assets can you have before losing your Age Pension?
By Robert Wright /February 28,2025/

There are many benefits to receiving an Age Pension or even a part pension, but there are limits to what level of income or assets you can have, to be eligible.
Regarding assets, the key limits as at 20 September 2024 are as follows:
To receive a full pension, assets (excluding the value of the primary residence) must be less than:
| Homeowner | Non-homeowner | |
| Single | $314,000 | $566,000 |
| Couple, combined | $470,000 | $722,000 |
- Indexed every 20 March, 1 July and 20 September. Source: Australian Government Services Australia.
To receive at least a part pension, assets must be less than:
| Homeowner | Non-homeowner | |
| Single | $695,500 | $947,500 |
| Couple | $1,045,500 | $1,297,500 |
| Couple – separated by illness | $1,233,000 | $1,485,000 |
- Indexed every 20 March, 1 July and 20 September. Recipients of Rent Assistance will have higher thresholds. Source: Australian Government Services Australia.
It’s important to note that if you get Rent Assistance, your cut off point will be higher. Use the Payment and Service Finder to find out your cut off point.
Asset reduction strategies
There are a number of strategies that may be used to reduce asset levels, which may result in qualifying for a part pension or increasing the current pension amount received.
However, before reducing your assets it is important to bear in mind whether your remaining savings can support any shortfall in your retirement income needs, as any increased pension amount may still be inadequate. Personal circumstances can also change and increase the reliance on your reduced savings. For example, future health issues may require a move into aged care, which can bring increased expenses.
With that in mind, here are six possible asset reduction strategies to help boost your pension:
- Gift within limits, for more than 5 years before qualifying age
If there is a desire to provide financial assistance to family or friends, gifting can reduce your assessable assets. The allowable amounts a single person or a couple combined may gift is $10,000 in a financial year or $30,000 over a rolling five financial year period. Any excess amounts will continue to count under the asset test (and deemed under the income test) for five years from the date of the gift. This is called deprivation.
If you are more than five financial years away from reaching your age pension age or from receiving any other Centrelink payments, you can gift any amount without affecting its eventual assessment once you reach age pension age.
- Homeowners can renovate
Your home is an exempt asset and any money spent to repair or improve it will form part of its value and will also be exempt from the assets test.
- Repay debt secured against exempt assets
Debts secured against exempt assets do not reduce your total assessable assets. An example is a mortgage against the family home, regardless of what the borrowed funds have been used to purchase. However, using assessable assets to repay these debts can reduce the overall assessed asset amount. Crucially, you must make actual repayments towards the debt; depositing or retaining cash in an offset account will not achieve this outcome.
- Funeral bonds within limits or prepaying funeral expenses
If you wish to set aside funds or pay for your funeral costs now, there are a couple of ways to do this which may reduce your assessable assets.
A person can invest up to $15,500 (as at 1 July 2024) in a funeral bond and this amount is exempt from the assets test. Members of a couple can have their own individual bond up to the same limit each. By contrast, if a couple invests jointly into a funeral bond, this must not exceed $15,500 i.e. it is not double the individual limit2.
In comparison, there is no limit to the amount that can be spent on prepaid funeral expenses. For the expenses to qualify, there must be a contract setting out the services paid for, state that it is fully paid, and must not be refundable. Importantly, both methods of paying for funeral costs are designed purely for this purpose and preventing assets from being accessed for any other reason.
- Contribute to younger spouse’s super and hold in accumulation phase
If you have a younger spouse who has not yet reached their Age Pension age and is eligible to contribute to super, contributing an amount into their super account may reduce your assessable assets. The elder spouse can even withdraw from their own super, generally as a tax free lump sum, to fund the contribution.
Investments held in the accumulation phase of super are not included in a person’s assessable assets if the account holder is below Age Pension age. Before using this strategy, any additional costs incurred should first be considered. Holding multiple super accounts may duplicate fees. Shifting funds into an accumulation account may increase the tax on the earnings on these investments to as much as 15%. Alternatively, earnings on the funds are tax free if invested in an account-based pension or potentially even personally.
Additionally, contributing to a younger spouse who is under Age Pension age, and still working, will ‘preserve’ these funds. They should also ensure they do not exceed their contribution caps3.
- Purchase a lifetime income stream
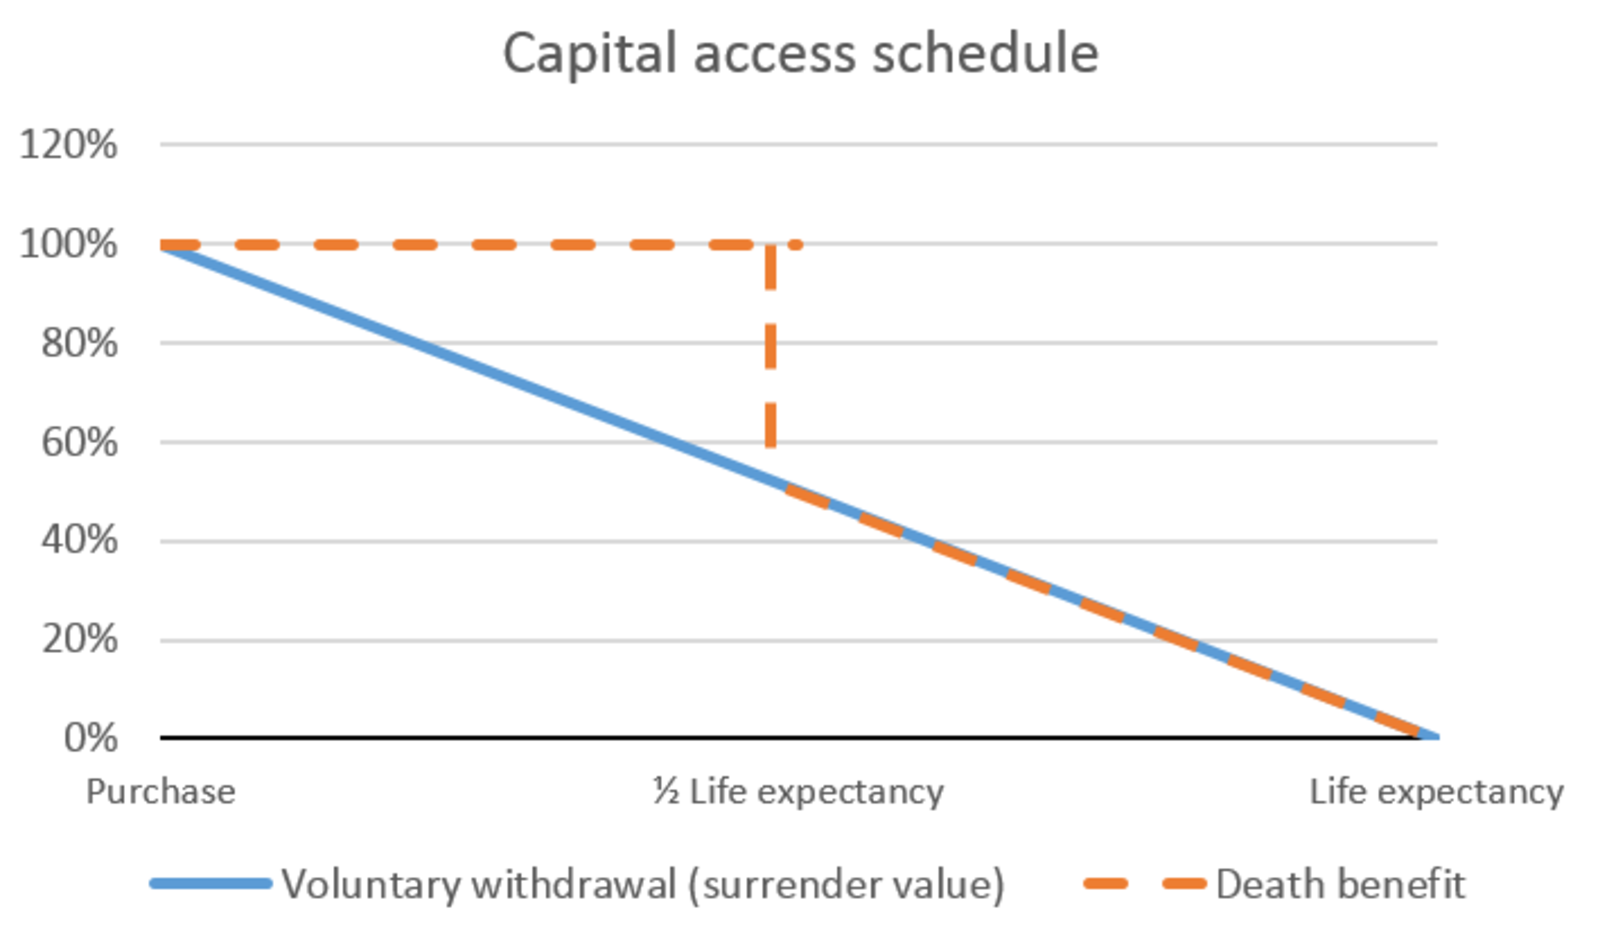
Lifetime income streams such as an annuity purchased after 1 July 2019 may be favourably assessed, according to the Social Services and Other Legislation Amendment (Supporting Retirement Incomes) Bill 20184. Where eligible, only 60% of the purchase price is assessed. This drops to 30% once the latter of age 84 (based on current life expectancy factors) or five years occurs.
To receive concessional treatment, the lifetime annuity must satisfy a ‘capital access schedule’ which limits the amount that can be commuted voluntarily or on death4. This is illustrated below:
- Source: Parliament of Australia.
Voluntary commutations must follow a ‘straight line’ declining value, falling to nil at life expectancy. The death benefit can be up to 100% until the investor reaches half of their life expectancy, at which point it will follow the voluntary withdrawal value4.
Conclusion
Reducing your assessable assets within the relevant assets test threshold can provide many benefits such as increasing your existing pension or allowing you to qualify for a part pension, if you are currently above the upper asset test threshold.
While it is tempting to intentionally reduce your asset levels to gain these benefits, it is important to remember the Age Pension payment rate is determined by applying both an income and assets test. The test that results in a lower entitlement determines the amount receivable. If the income test is the harsher test, reducing your assessable assets may provide little or no benefit.
If the assets test is harsher, you should not lose sight of the fact that any reduction in your assets means there are fewer assets for you to call upon if required.
References:
1. https://www.servicesaustralia.gov.au/assets-test-for-age-pension?context=22526
2. https://www.servicesaustralia.gov.au/funeral-bonds-and-prepaid-funerals?context=22526
3. https://www.ato.gov.au/super/self-managed-super-funds/contributions-and-rollovers/contribution-caps/ and https://www.ato.gov.au/individuals-and-families/super-for-individuals-and-families/self-managed-super-funds-smsf/contributions-and-rollovers/contribution-caps
4. https://parlinfo.aph.gov.au/parlInfo/search/display/display.w3p;query=Id%3A%22legislation%2Fems%2Fr6224_ems_58c16ce0-95fa-4ef6-afe4-668b3e41fb62%22
Source: BT