
Tag Archives: Economic Update
Federal Election 2025
By Robert Wright /May 23,2025/

During the Federal Election campaign, the Government made a number of election promises, which may impact your finances. There were also a number of support measures proposed in the recent Federal Budget. What could this mean for you?
These announcements are proposals only and may or may not be made law. The information below, including the policy details and proposed start dates, is based on the information announced as at 5 May 2025. You should speak to your financial adviser to discuss how these proposals could apply to you.
Election promises
Taxation
$1,000 instant tax deduction for work-related expenses, proposed from 1 July 2026.
What’s proposed?
Taxpayers who have eligible work-related expenses may be able to claim a tax deduction of up to $1,000 without having to keep individual receipts. It will still be possible to claim work-related expenses above this limit, however evidence will be needed.
Who could benefit?
The deduction will be available to people with ‘labour income’. This doesn’t include income from running a business or from investments, where the usual rules will continue to apply.
$20,000 small business instant asset write-off extension, proposed from: 1 July 2025 to 30 June 2026.
What’s proposed?
The higher instant asset write-off threshold of $20,000, which currently applies until 30 June 2025, is proposed to be extended for another 12 months until 30 June 2026. The threshold is available for more than one asset. Eligible businesses can continue to place assets valued at $20,000 or more into a depreciation pool, where a deduction of 15% can be claimed in the first income year and 30% thereafter.
Who could benefit?
Small businesses with an aggregated annual turnover below $10 million will be able to claim an immediate tax deduction for the full cost of eligible assets costing less than $20,000 that are first used or installed ready for use by 30 June 2026.
Help for home buyers
Expanded ‘Help to Buy’ scheme, proposed from: to be confirmed.
What’s proposed?
The Government has proposed to expand access to the Help to Buy scheme to more home buyers by increasing the property price caps and income test thresholds, which determine eligibility to participate in the scheme.
The scheme is a shared equity scheme, which allows eligible home buyers to purchase a home with a smaller deposit, of as little as 2%. The Commonwealth will contribute up to 30% of the purchase price of an existing home and up to 40% of the purchase price of a new home.
The Help to Buy scheme is expected to open for applications later this year. Although the Federal Government has legislated the scheme, the States and Territories need to pass legislation for it to operate in each jurisdiction.
Who could benefit?
Increasing the income cap and property price caps will enable more people to participate in the scheme.
For singles, the income cap will increase from $90,000 to $100,000. For joint applicants (and single parents), the income cap will increase from $120,000 to $160,000.
The property price cap will depend on the location of the property and details can be found in the Government’s media release.
Participants must meet a number of eligibility rules and conditions, including repaying the Government when the home is sold or when certain changes occur in their circumstances. So it’s very important to understand the rights and responsibilities of participating in the scheme before making an application.
Previously announced measures
Cost of living support
The below proposals were announced by the Government in the March 2025 Federal Budget.
Energy bill relief extended for six months, proposed from: July 2025.
What’s proposed?
The Government will provide further energy rebates in addition to the bill credits people have received since July 2024. The rebate will be applied automatically to electricity bills between 1 July and 31 December 2025, in two quarterly instalments of $75.
Who could benefit?
All Australian households and eligible small businesses will receive the additional energy rebate. It’s expected the eligibility rules that apply to small businesses (quarterly power consumption) will not change.
Lower cap for PBS medicines, proposed from: January 2026.
What’s proposed?
The maximum cost of Pharmaceutical Benefits Scheme (PBS) medicines will decrease from $31.60 to $25 per script.
Who could benefit?
This will benefit people who don’t hold a concession card and would otherwise pay the maximum amount to fill a script. It doesn’t apply if the script is for a medicine not on the PBS, which may cost more than $25. Pensioners and Commonwealth concession cardholders will continue to pay the subsidised rate of $7.70 per PBS script until 1 January 2030. This is an existing measure.
Student loans to be cut by 20%, proposed from: 1 June 2025.
What’s proposed?
Student loans will be reduced by 20% before the annual indexation (at a rate of 3.2%) is applied on 1 June 2025.
Who could benefit?
The changes will benefit all people who have Higher Education Loan Program (HELP) Student Loans, VET Student Loans, Australian Apprenticeship Support Loans, Student Start-up Loans and Student Financial Supplement Scheme, based on their outstanding 1 June 2025 balance.
Importantly, voluntary loan repayments that are processed before 1 June will reduce the loan balance that’s indexed on 1 June. However, the 20% debt reduction will be applied to the 1 June balance. So if this proposal is legislated, before making a voluntary repayment, it’s worth doing the numbers to see if it’s best to make a voluntary repayment before or after the 20% reduction and indexation is applied on 1 June. The table below provides an example which shows the difference between making a $5,000 voluntary repayment before and after 1 June, where the outstanding debt balance is $30,000.
| Outstanding debt today | Voluntary repayment before 1 June | Loan balance on 1 June (after 20% reduction and indexation applied)
|
Voluntary repayment after 1 June | Outstanding balance |
| $30,000 | $0 | $24,768 | $5,000 | $19,768 |
| $30,000 | $5,000 | $20,640 | $0 | $20,640 |
Reduced student loan repayment obligations, proposed from: 1 July 2025.
What’s proposed?
The minimum income that can be earned before student loan repayments need to be made is proposed to increase. This is in addition to the standard indexation of the income repayment thresholds which ordinarily happens on 1 July each year. Also, the way repayments are calculated will be changed.
Who could benefit?
People with student debts will benefit from lower compulsory loan repayments in 2025/26 and beyond, if their ‘repayment income’ is above the minimum threshold at which loan repayments need to be made and less than $180,000.
The minimum income threshold is $54,435 in 2024/25 and will automatically increase to $56,156 on 1 July. Also, the Government has proposed:
- increasing the minimum income threshold to $67,000; and
- calculating repayments on just the repayment income earned above the income threshold, not on total income.
The list of qualifying student loans is the same as those to be eligible for the 20% debt reduction on 1 June 2025 (see above).
Expanded ‘First Home Guarantee’ program, proposed from: to be confirmed.
What’s proposed?
Help will be extended to all first home buyers under the Commonwealth’s First Home Guarantee Scheme. The scheme enables home buyers to purchase their first home with as little as a 5% deposit. The Government provides a guarantee for the remaining portion of the deposit (up to 15%), to ensure the first home buyer doesn’t pay Lenders Mortgage Insurance.
Currently, income limits and property price caps apply and access is only granted to a maximum of 10,000 eligible participants each year. These requirements are proposed to be removed, opening the scheme to all first home buyers.
Who could benefit?
The extension of the scheme may help first home buyers to purchase their first home sooner. It’s important to understand that purchasing a home with a smaller deposit may increase the total interest that is paid over the life of the loan.
Superannuation
The below measure was initially announced by the Government in 2023, with support reconfirmed in the 2023 Federal Budget. Legislation was introduced to Parliament to make this change law in 2024 but lapsed when the election was called. The Government will need to reintroduce and pass legislation in Parliament before this change can take effect. Given the complexity of the policy and the number of days that Parliament may sit between now and 1 July, we don’t know if the proposed start date will change if the policy is reintroduced.
Higher taxes for balances over $3 million, proposed from: 1 July 2025.
What’s proposed?
Where people have more than $3 million in super (both accumulation and retirement values) from 1 July 2026, higher taxes are to be paid on investment earnings, with payment due in the 2027 financial year.
Currently, investment earnings within the ‘accumulation phase’ of superannuation are taxed at a maximum rate of 15%. With a ‘retirement phase income stream’, such as an account-based pension once retired, investment earnings are generally tax free.
It’s proposed that from 1 July 2025, where a person has a ‘total super balance’ exceeding $3 million at the end of the financial year, an additional tax of 15% will apply to a portion of the investment earnings. The new tax will be called ‘Division 296 tax’, as that is the name of the relevant section of tax law where the proposed rules are covered.
Additional tax won’t be paid where the total super balance is less than $3 million on 30 June 2026 (the end of the first year it will apply) or the end of any following financial year.
Where to from here?
It’s important to remember these changes need to be legislated to become law. The information above is based on the announcements made to date, and there may be changes to the start dates or other details if the policies are formalised. You should speak to a financial adviser to understand more about what has been announced and how these changes could apply to you.
Source: MLC
Where is the Recession?
By Robert Wright /May 19,2023/

Key points
- A progress report on inflation: Inflation appears to have peaked, led by improvements in core goods prices and rate sensitive sectors like housing. The policy focus has shifted to labour market normalisation where early signs of progress are emerging.
- Is a soft landing in sight? The Fed remains committed to doing “whatever it takes” to bring inflation to the targeted level. Despite the aggressive tightening we’ve seen so far, alternative data indicators suggest that the economy remains on relatively solid footing.
- Equity market positioning: We are positioned for themes of continued high rates, improving sentiment outside the US and a potential soft economic landing. This is expressed with a preference for value particularly in cyclical sectors including capital goods, consumer durables, autos and airlines.
2022 was a year where extreme macroeconomic and geopolitical events shaped market behaviour. The US Consumer Price Index (CPI) peaked at 9.1%, the highest level in over 40 years. The subsequent policy response saw the US Federal Reserve (Fed) deliver 4.25% of rate hikes across only seven meetings. This was the fastest cycle of rate hikes since the early 1980s, a period of stubborn inflation and aggressive policy action that ultimately ended in a recession.
As we begin 2023, there’s a greater level of clarity around some of the questions that have driven markets over the last year. Recent inflationary data shows improvements in the trajectory of core goods prices and rate sensitive components. Now, the focus of policymakers has shifted towards restoring balance in the labour market and doing “whatever it takes” to bring inflation to the targeted level. As we enter a new phase of tightening beyond peak price pressures, what does alternative data reveal about the path of inflation and the recession that so many are expecting?
A progress report on inflation
In the final months of 2022, long awaited improvements in the trajectory of inflation began to surface. Figure 1 shows the widening gap between current reported inflation and where US CPI is expected to stand in six months based on a broad range of leading economic indicators and text mined commentary on inflation. Peak inflation seems to be behind us and a clearer path towards meeting central bank objectives has started to appear. As observed in the inflation GPS measure, the sentiment of corporate comments around cost pressures and the effects of inflation on margins hasn’t showed signs of deteriorating as the outlook improves.
Figure 1: US Inflation GPS shows continued decline in the trajectory of consumer prices
Current US Inflation vs six month inflation expectations

Source: Refinitiv DataStream, chart by the BlackRock Investment Institute, December 2022. The BlackRock Inflation GPS shows where core (excluding food and energy) consumer price inflation may stand in six months’ time. The GPS models the relationship between rates of core inflation and a broad set of economic indicators including measures of slack, inflation expectations, and other inflation related data such as business surveys and wages. It also incorporates a proprietary Systematic Active Equity signal measured through text mining of commentary on inflation.
Core goods prices, where the initial surge in inflation was the most robust, are showing significant progress. This has continued to play out with the shift in spending from goods to services throughout the economic reopening and the healing of supply chain bottlenecks. Figure 2 shows average freight transportation costs which have fallen back to pre pandemic levels. These costs were previously 14 times greater during the peak of supply chain issues.
Figure 2: Global supply chains have mostly recovered with shipping costs returning to pre COVID levels
Average freight costs for shipping a 40ft container

Source: BlackRock, with data from Bloomberg, as of January 2023. All amounts in USD.
Shelter is another category where alternative data is pointing to a clear disinflationary trend throughout 2023. Shown in Figure 3, the growth rate of new online rental listings in the US has started to decline. The Owners’ Equivalent Rent (OER) component of CPI which captures both new and continuing leases tends to lag this alternative rental data by 6 to 9 months. This suggests that the trend we’re seeing in new leases will increasingly impact CPI data as the year goes on.
Figure 3: The growth rate of new rental leases has started to decline, a trend that will increasingly impact CPI data
Online new rental leases vs. Owners’ Equivalent Rent (OER)

Source: BlackRock, with data from Apartment List and Zillow, January 2023.
For the next phase of the tightening cycle, Fed officials have shifted their focus to labour markets. Wages have remained a persistent driver of broad-based services inflation since the economic reopening began. Historical periods of inflation have shown that reining in wage inflation is a critical step in restoring price stability and preventing long-run expectations from becoming unanchored. In early November, Fed Chairman Jerome Powell identified 3.5% wage growth as a targeted level that would be consistent with the Fed’s 2% inflation objective.
To monitor the trajectory of wage growth, we use online job postings in the US for a real time view of employment cost data ahead of official releases (Figure 4). Wage growth has started to moderate in recent months and shows signs that the labour market is finally beginning to cool. However, more progress is needed to reach the Fed’s target especially in the services sector where inflationary pressures remain the most stubborn.
Figure 4: Wage growth is showing signs of moderating, but more progress is needed
Year over year wage growth for goods vs services roles

Source: BlackRock, with data from Burning Glass Technologies, as of January 2023.
Is a soft landing in sight?
The likelihood of a soft vs hard landing depends on how healthy the economy remains as inflation continues to normalize and how policymakers react to ongoing developments. So what does the data tell us about where the economy is heading?
Let’s first examine the underlying drivers of the readjustment that’s taking place in labour markets. Following COVID-19, a labour shortage emerged as many individuals didn’t immediately return to the workforce. Simultaneously, the economic reopening drove robust demand for workers and a significant increase in job openings, many of which remained vacant due to labour supply constraints. As a result, the recent normalisation in labour markets and wages has mostly come from a decrease in job openings. This differs from past periods of inflation where monetary tightening caused severe job losses and high unemployment that ultimately ended in a recession.
Figure 5 shows the decline that we’ve seen in the number of online job postings as labour demand falls. Most of the pullback in job postings is concentrated in the technology sector. This is also the case for layoffs which remain extremely benign across the broader economy. Importantly, job openings remain elevated in aggregate relative to pre COVID, suggesting that the gap between labour demand and supply can continue to narrow through a decline in job openings rather than severe layoffs.
Figure 5: Falling labour demand has come through declines in job openings, not layoffs
Volume of online job postings normalised to 2020 levels

Source: BlackRock, with data from Indeed.com, as of January 2023.
Along with company behaviour, we’re closely monitoring consumer activity for signs of weakness. Figure 6 shows US inflation adjusted consumer spending in the services sector which remains relatively stable and above pre COVID levels despite starting to decline particularly for the lowest income cohort. How has this level of consumer activity been sustainable as savings rates have fallen to historical lows amid higher interest rates? The previous period of unprecedented fiscal stimulus throughout the pandemic has kept the total level of household savings in excess, even long after stimulus payments have tapered off. Furthermore, household interest payments remain well below the pre COVID trend with less debt on consumer balance sheets. The combination of sustained excess savings, lower debt levels, and muted layoff activity has allowed consumer spending to remain relatively resilient over the course of the Fed’s tightening cycle.
Figure 6: US Services spending remains above 2019 levels despite signs of weakness
3Y Discretionary service consumption by income cohort adjusted for inflation
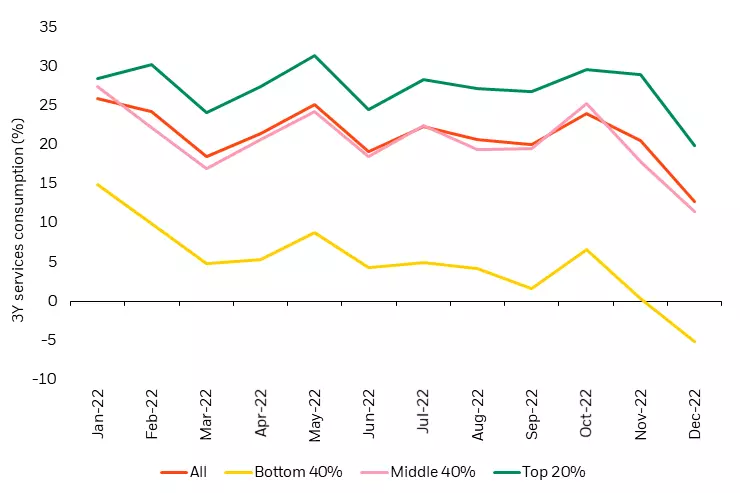
Source: BlackRock, Yodlee/ConsumerEdge, Earnest Research, as of December 2022.
Alternative data reveals an improving picture for inflation, orderly rebalancing of the labour market and a relatively healthy consumer – each currently more supportive of the case for a soft landing than a hard landing.
Market pricing has increasingly shifted towards the expectation for interest rate cuts by the end of 2023 (Figure 7). This can be supported by two opposing viewpoints: 1) the hard landing scenario which expects policymakers to overtighten and engineer a recession, or 2) a scenario where inflation swiftly returns to the 2% target and the Fed is able to begin easing financial conditions. In our view, both of these scenarios are unrealistic. Instead, we believe rates will remain higher for longer rather than a near term policy pivot. Today’s relatively stable economy may remain more resilient to high rates and policymakers are likely to delay easing financial conditions due to the lingering effects of two years of excessive inflation.
Figure 7: Market is currently pricing in rate cuts by the end of 2023
Market implied policy rates

Source: BlackRock, with data from Bloomberg, as of January 19, 2023.
Equity market positioning for Q1, 2023
After a challenging year for equity markets in 2022, the downward trajectory of inflation and continued economic stability point to a slightly more positive outlook in the coming months. How are these insights shaping our positioning across the global equity landscape?
An expanding global opportunity set
Like the US, the outlook for Europe has started to improve despite core inflation remaining at record highs. A warmer than expected winter has relieved some of the pressure from the energy crisis. Wage growth has also started to come down in Europe as labour markets normalise at an even faster pace than in the US. In China, the economic reopening has quickly taken off. Along with relaxed COVID-19 restrictions, there’s been an easing in common prosperity and antimonopoly regulations. This is an added tailwind to the improving sentiment towards Chinese assets, particularly in sectors like education, internet and real estate that were most impacted by these regulatory initiatives.
Sector positioning for a potential soft landing
Our global portfolios maintain a preference for value vs growth based on continued themes of high rates and inflation followed by a potential soft landing. Notably, we’ve seen a shift in the underlying sectors driving the top down leadership of value. What was previously led by the energy sector has shifted to favour cyclical sectors that have been heavily discounted over the last year, including capital goods, consumer durables, autos and airlines where we’re currently overweight. These are well positioned for a continued high interest rate environment where the economy ultimately avoids a deep recession.
Conclusion
As we enter the next phase in the fight against inflation, market focus has shifted to whether policymakers can achieve a durable decline in inflation without causing a recession. Using alternative data to cut through the noise of hard vs soft landing speculation, we see signs of progress in restoring price stability while maintaining economic strength. At the same time, macroeconomic uncertainty remains high and we expect market volatility to persist as conditions evolve. This makes a data centric investment approach crucial to navigating today’s complex environment, allowing us to remain nimble as investors during a time where dynamism matters most.
Source: BlackRock
Economic and market overview
By Robert Wright /November 28,2022/

Pleasingly, global share markets fared well in October and recovered most of their lost ground from September. Locally, the S&P/ASX 200 Index returned 6.0%.
The sharp reversal in sentiment was typical of this year; market volatility has picked up meaningfully over the past few months, resulting in substantial swings in equity prices.
Fixed income performance was mixed. Yields drifted lower in Australia, resulting in modest positive returns from the domestic bond market. Yields continued to rise in the US, however, which resulted in negative returns from Treasuries and from global bond indices.
Investors remained focused on the persistence of inflation and, in turn, the outlook for interest rate policy in key regions.
Australia
Headline inflation quickened to an annual pace of 7.3% in the September quarter; the highest level for more than 30 years. The trimmed mean – central bank officials’ preferred measure – also increased, to 6.1% year-on-year.
The Reserve Bank of Australia continued to tighten policy settings against this background, raising official interest rates again on 1 November, by 0.25 percentage points. This could be an indication that official borrowing costs will not be raised as meaningfully as previously thought.
Official interest rates are now 2.85% and may be raised again in December. Consensus forecasts currently suggest interest rates could peak at around 3.75% in mid- 2023.
New Zealand
As expected, interest rates were increased by a further half percentage point, to 3.50%, as policymakers remained focused on bringing down inflation. Headline inflation quickened to an annual pace of 7.2% in the September quarter.
Substantial rate hikes in the year to date appear not to have had their desired effect, suggesting further policy tightening may be required. Forecasts currently indicate that interest rates could be 5%, or higher, by mid-2023.
US
The latest data showed the US economy expanded at an annual pace of 2.6% in the September quarter. This represented a sharp rebound from the June quarter, when the economy contracted slightly.
Headline inflation remained above 8% year-on-year, although the Federal Re- serve did not meet in October and interest rates were therefore unchanged over the month. That said, further policy tightening is anticipated.
The labour market remains buoyant. More than 250,000 new jobs were created in September, taking the total in the year to date to nearly four mil- lion. A low unemployment rate – currently just 3.5% – means firms are typically required to pay up to attract new employees. Wages are rising at an annual pace of 5.0%.
Europe
The European Central Bank raised interest rates by a further 0.75 percentage points, as officials continued to battle persistently high inflation. Borrowing costs have been raised to their highest level since 2009.
CPI in the Eurozone remained around 10% year-on-year, partly reflecting the impact of elevated energy prices.
Political developments continued to dominate attention in the UK. The new chancellor swiftly reversed the mini-budget that had been proposed by his predecessor. This saw the UK currency and bond market claw back their lost ground from September.
The new leaders must address a slowing economy and spiralling inflation. CPI is currently running above 10% year-on-year, resulting in sharp falls in real wages for most workers and clouding the outlook for spending.
Asia
It seems Chinese officials are likely to persevere with their ‘zero Covid’ policy, which is dampening growth prospects. President Xi tightened his grip on power during the month, by appointing various loyalists into key government positions.
The Chinese yuan remained un- der pressure, owing to the deteriorating economic outlook. The currency depreciated to a 15-year low against the US dol- lar during October.
In Brazil, left wing candidate Lula da Silva was elected as the new President; a remarkable turnaround in fortunes given the former leader was in prison for corruption three years ago. His victory was welcomed by environmentalists given his pledge to address soaring de- forestation rates in the Amazon rainforest.
Australian dollar
The Australian dollar briefly fell below 62 US cents in mid-month, but clawed back loss- es and closed October little changed from its end-September levels (around 64 US cents).
The AUD was similarly flat against other major currencies. The dollar trade-weighted index declined just 0.3% over the month.
Australian equities
Australian shares added 6.0% in October, recouping most of September’s losses.
A fall in domestic bond yields supported a ‘risk-on’ attitude among investors and enabled nine out of the 11 industry sectors to generate positive returns.
The Financials (+12.2%) sector was the strongest performer, led by strong gains among the major banks. Shares in all of the ‘big four’ banks enjoyed gains of between 12% and 17%.
Oil prices rose following OPEC+’s decision to lower production quotas and after the European Union announced further sanctions against Russia. This added 9.3% over the month in the Energy sector.
Stocks in the Materials sector (-0.1%) struggled as Chinese officials reiterated their commitment to a ‘zero-Covid’ policy. Stocks in the Consumer Staples sector also struggled, resulting in the sector returning -0.2%.
Small caps outperformed their larger peers and all sectors in the S&P/ASX Small Ordinaries Index posted positive returns.
Listed property
Global property securities benefited from the general improvement in sentiment to- wards equity markets, with the FTSE EPRA/ NAREIT Developed Index adding 3.6% in Australian dollar terms.
There were particularly strong inflows into western markets. France (10.1%), Australia (9.9%) and Spain (7.3%) all enjoyed strong gains, for example.
More defensive Asian property markets such as Hong Kong and Singapore fared less well, declining by 11.4% and 6.0%, respectively.
Global equities
According to a recent report, inflows into global share markets picked up sharply following September’s weakness.
The influential S&P 500 Index in the US rose 8.1%, while the MSCI World Index closed the month 7.8% higher.
In the US, releases of quarterly financial results from tech gi- ants disappointed investors and meant returns from the NAS- DAQ failed to keep pace with the broader S&P 500 Index.
Asian indices performed poorly, partly due to significant weak- ness among Chinese shares. The CSI 300 fell 7.8%, while Hong Kong’s Hang Seng slumped 14.7%.
Japanese stocks fared quite well in contrast, with the Nikkei adding 6.4%.
European shares also registered solid gains. The Euro Stoxx 50 closed the month 9.0% higher.
Finally, the world’s richest per- son – Tesla founder Elon Musk – bought Twitter for US$44 billion.
Global and Australian fixed income
The federal funds rate was unchanged in October, remaining in a range between 3.0% and 3.25%.
Money markets have priced in the likelihood of a 0.75 percent- age point increase in the federal funds rate when policymakers meet in November, and an additional rate hike in December.
In October as a whole, 10-year Treasury yields rose 22 bps, closing above 4% for the first time since before the Global Financial Crisis in 2008. In fact the whole yield curve rose. These moves resulted in negative performance from the Treasury market, as well as from global fixed income indices.
Government bond yields were little changed in either Germany or Japan over the month.
In the UK, gilt yields fell back sharply from their September highs after the previous chancellor’s proposed tax cuts were abandoned by the incoming government. This resulted in favourable returns from UK bonds and helped ease pressure on pension funds in the country.
Australian Commonwealth Government Bond yields also trend- ed lower, closing the month down 13 bps.
Reserve Bank officials slowed the pace of their policy tightening, raising official interest rates by 0.25 percentage points.
Global credit
Investment grade credit spreads were little changed in the month as a whole.
With spread movements providing a neutral performance contribution, returns from corporate bonds were dominated by the receipt of regular coupon income. This steady flow of income supported positive returns from the asset class.
Returns for mixed-grade credit portfolios were also boosted by much-improved performance from high yield securities. Spreads in this part of the market had widened meaningfully over the past few months; seemingly sufficiently to help attract value-oriented investors.
Source: This was prepared and issued by First Sentier Investors (Australia) IM Ltd (ABN 89 114 194 311, AFSL 289017) (FSI AIM), which forms part of First Sentier Investors, a global asset management business. First Sentier Investors is ultimately owned by Mitsubishi UFJ Financial Group, Inc (MUFG), a global financial group.
Investment Market Outlook: Volatility Rises, Value Emerges
By Robert Wright /May 25,2022/

With war in Eastern Europe, inflation surging and Covid lockdowns inhibiting industrial production in parts of China, investment markets faced a rising tide of volatility over the past quarter.
Yet while this may feel like the worst of times, it may really be that the 14 or so years since the GFC are the outlier and the new market environment is more normal than it looks.
What’s influencing the outlook?
Ukraine and China
The cruelty of Russia’s ‘special military operation’ has shaken the world but history tells us war does not always derail investment markets. Strikingly, global shares fell over 30% when the world locked down for Covid (February 2020 to March 2020). But they’ve risen slightly since the fighting started in Ukraine.
There are more specific forces at play that will influence markets. There are widespread attempts to shun Russian energy sources, which constrains supply and means oil and gas prices are rising. Higher energy prices are a major economic blow because they suck cash from consumers’ pockets. Meanwhile, the loss of Ukraine’s harvests will add to food costs.
Somewhat lost in the fog of war is another Chinese Covid crisis – as we write there are over 20 million people locked down in Shanghai as Chinese policymakers stick to a futile zero-Covid policy. That has implications for Chinese industrial production, keeps the pressure on global supply chains and curtails Chinese consumer confidence and spending.
Inflation and interest rates
For investors today, inflation and interest rates are the terrible twins: inseparable and inexorably influencing investment assets. Hopes that supply chain pressures would ease as the world recovered from Covid have been dashed by the Ukraine crisis and China’s decision to slam the doors on large chunks of its population. That means inflation is now at rates unthinkable a year ago – 7.9% in the US, 6.2% in the UK, 7.5% in the Euro area. And around the world rates have started to rise in response. There are more rises to come, with the US response stretching to a potential seven rates hikes.
Who’s going to drop the ball?
This confluence of events throws up another risk – major policy error by governments or central banks. A recent IMF bulletin sums it up: “There are already clear signs that the war and resulting jump in costs for essential commodities will make it harder for policymakers in some countries to strike the delicate balance between containing inflation and supporting the economic recovery from the pandemic.”
What’s normal anyway?
According to Andrew Garrett, Investment Director at Perpetual Private, markets are now dealing with geopolitical risks and inflation pressures they haven’t experienced for over a decade. Yet while Perpetual Private does expect higher volatility and lower overall returns, that doesn’t mean well-diversified portfolios can’t deliver solid results for investors. Instead, a more nuanced market environment places a premium on specific investment skills.
“The long-running, low-rate environment that’s just ended inflated investment markets and made growth assets, especially ‘promising young tech stocks,’ more attractive,” says Andrew. “To use a Buffetism, it lifted all boats.”
By contrast, a rising-rate environment is one where active investors with a nose for quality can do well. We’re likely to see better results from value stocks (ie profitable companies with predictable earning whose full potential is not built into their ticker price). And from value managers – like Perpetual – who specialise in the deep research needed to unearth those opportunities.
Recent results in Australia may be a sign of things to come in this growth/value shift. Value shares were up 11.7%. Growth shares lost 4%. (As measured by the MSCI Australia Value and MSCI Australia Growth indices for the March quarter).
Source: Perpetual