
Tag Archives: Economics
The absurdity and calamity of US tariff policies
By Robert Wright /May 23,2025/

US tariffs are poorly designed, badly implemented and are already damaging both the US and global economies. The economic damage will only get worse as uncertainty further undermines business and consumer confidence and results in dislocation of global supply chains.
Determining the extent of economic damage, and financial market implications, is difficult because we don’t know what tariffs will actually be implemented or how many backflips there are before then. There’s no clear, defining strategy. The justification for tariffs oscillates between reinvigorating US manufacturing, raising revenue to fund tax cuts, the cost of the US providing global security, the provision of the US dollar to support global trade and financial markets, and broadly addressing an ‘unfair’ trading system. Different justifications would lead to different structures of the tariff regime. Adding to uncertainty, key individuals in the administration have different goals for tariffs.
- The obsession with bilateral trade deficits is baseless
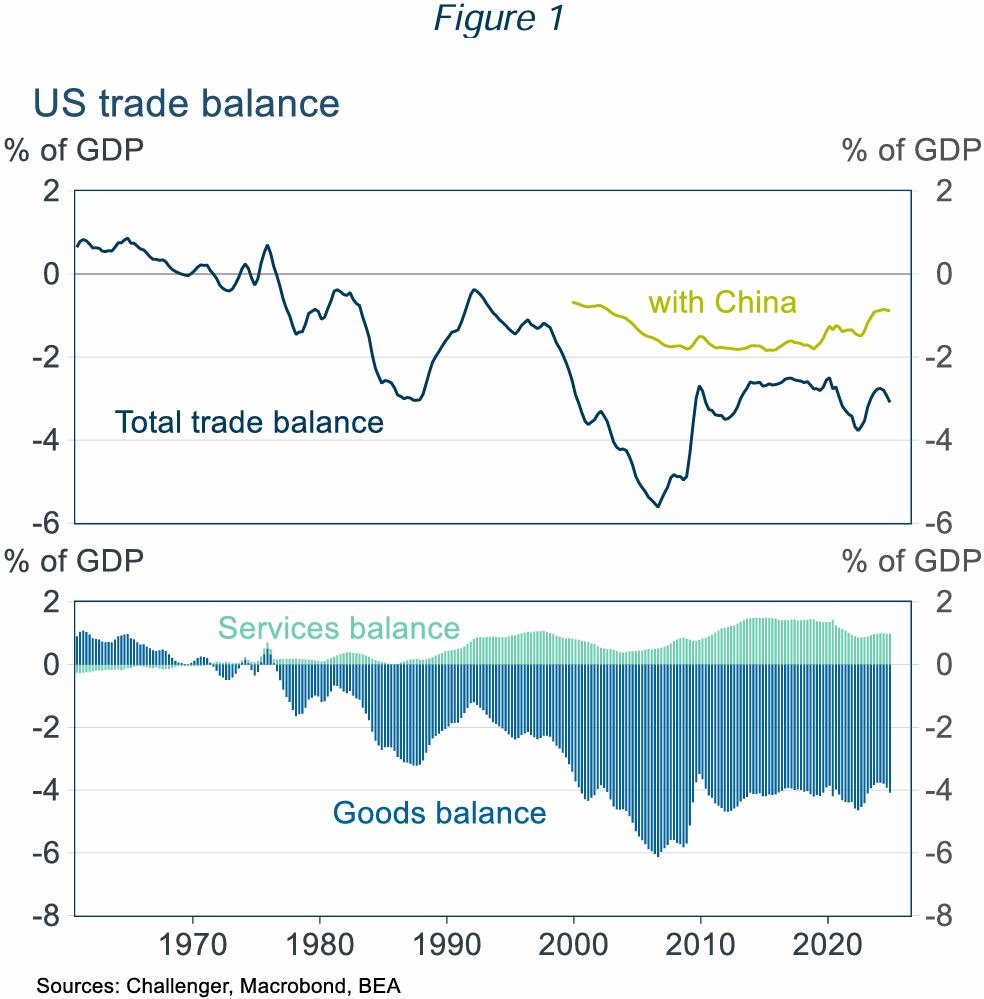
President Trump’s tariff obsession is rooted in a dislike of trade deficits. The United States has run a trade deficit since the mid-1970s (Figure 1). He attributes this deficit to unfair trade policies in other countries and an overvalued US dollar, resulting from US dollar demand given its role in international trade and finance. But the trade deficit also depends on US domestic conditions, notably the US Government’s huge fiscal deficit, currently 5% of GDP.
Balanced national trade doesn’t need bilateral balanced trade
Even if balanced trade at the country level was desirable, there is no reason for this to apply country by country. Even countries with balanced aggregate trade run large trade deficits or surpluses with almost all of their trading partners: Belgium had balanced trade with just two countries; and Canada, Finland, South Korea and South Africa each had balanced trade with just one of their trading partners. Each of these five countries had significant bilateral trade surpluses or deficits with over 150 of their trading partners. The US goal of balanced bilateral trade with every country is, frankly, bonkers.
- The calculation of tariff rates is absurd
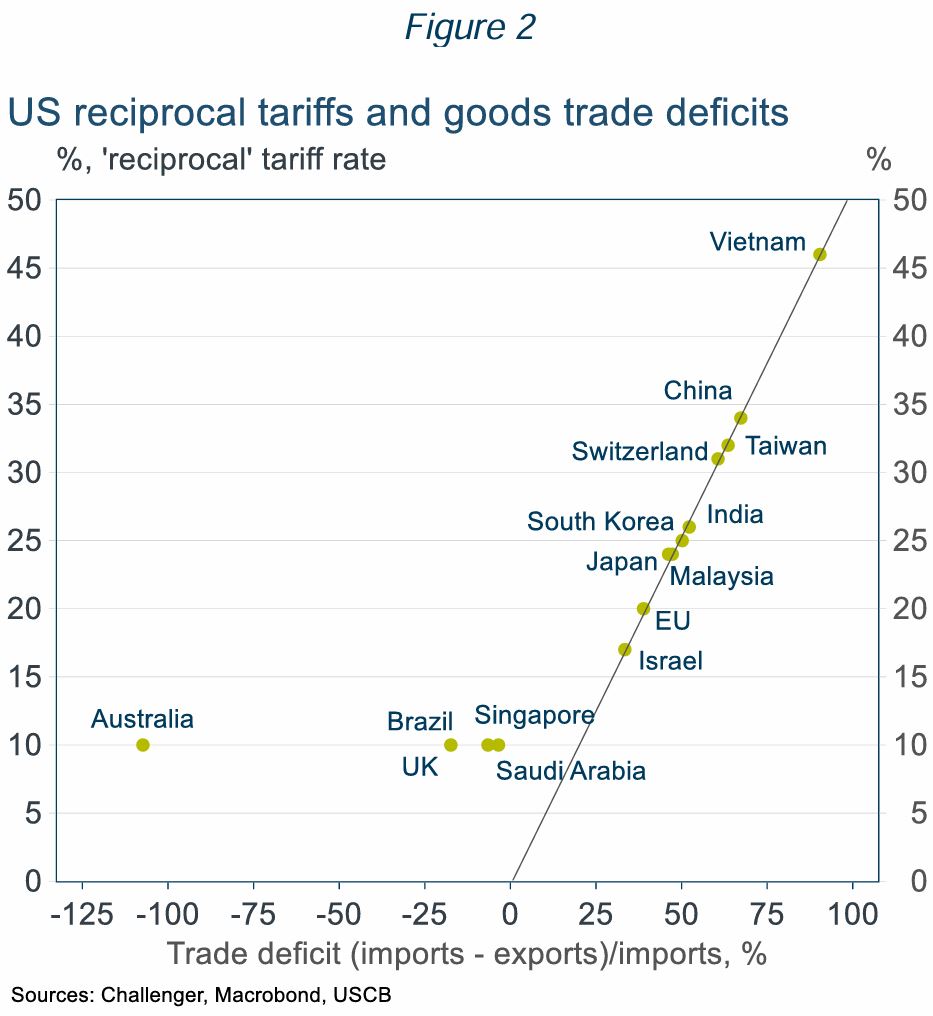
- Bilateral trade balances are meaningless but determine the US ‘reciprocal tariffs’ (Figure 2).
- Even countries the US has a trade surplus with, including Australia get a 10% tariff. If Australia applied the same logic as the US, we’d impose a tariff on the US of around 50%.
- The US has a surplus in services trade of 0.25% of GDP (partly offsetting the goods trade deficit of 1% of GDP; Figure 1) but ignores services trade in its calculation of tariffs.
- The tariffs are badly designed reflecting unclear and inconsistent goals
The US tariff regime has a mix of tariffs on specific goods (steel, aluminium, vehicles) and on specific countries (Canada, Mexico, China and the reciprocal tariffs) reflecting the varied goals of the tariffs. But many of these goals are in conflict. If, as Trump claims, tariffs raise revenue without increasing US prices by forcing foreign suppliers to absorb the tariff, then US manufacturers won’t be more competitive as US prices won’t be higher. And if tariffs are successful in boosting US production, then there would be fewer imports, and so less tariff revenue.
Several bad design elements of the tariffs mean there will be further changes:
- Different tariff rates distort trade for little benefit – for example, Apple intends to ship iPhones to the US from India rather than China as US produced iPhones would be prohibitively expensive.
- High tariffs are being applied to goods the US can’t, or won’t, ever produce – for example, some minerals and shoes (most come from China and Vietnam with 145% and 46% tariffs).
- Tariffs are being applied to inputs used by US manufacturers, increasing exporters’ costs.
- The effective trade embargo with China will be disruptive to the US economy
The 145% punitive tariff applied to China makes most imports from China prohibitively expensive. But the US economy is not ready to disengage from China, which has supplied 13% of US imports. Factories don’t pop up overnight.
Using a fine disaggregation, breaking down goods into their constituent parts, over half of US imports are from China. Alternative suppliers just don’t exist.
For finished consumer goods with very high import shares from China, large price increases and stock shortages will be disruptive to consumers and impact consumer sentiment and support for tariffs. The economic impact will be even greater for those imports predominantly sourced from China that are used as inputs in US production, such as explosives, machinery and various chemicals. For example, China is also a key source for base ingredients used in manufacturing medicines and finished medicines.
- The tariff regime won’t survive its poor design, but tariffs won’t go away completely
The US tariff regime is already unravelling with holes poked in the tariff wall.
- Reciprocal tariffs were paused until 9 July (the baseline 10% tariff still applies to all countries).
- Consumer frustration will mount facing higher prices and product shortages. For example, phones, computers and some other electronics have been exempted from the China tariffs.
- Businesses are getting traction lobbying on the cost to production from tariffs, for example there will be a partial rebate on the 25% tariffs on car parts used as inputs in US manufacturing.
- The US has said some 70 countries want to negotiate tariff reductions. Yet negotiating a detailed trade agreement takes time. The renegotiation of the US-Canada-Mexico trade agreement in President Trump’s first term took 18 months. A rushed negotiation will contain flaws.
However, President Trump strongly believes in the benefits of tariffs for promoting US manufacturing and he needs the revenue. He has committed to using tariffs to reduce income taxes, even musing that income taxes could be eradicated. But a 10% uniform tariff has been estimated to raise just $1.7 trillion over 10 years, a 20% tariff $2.6 trillion. This is substantially less than the estimated cost of $5 to 11 trillion of the tax cuts already promised by President Trump.
- What does the future hold?
There will be many more turns in the road with backflips, reduced tariffs for goods the US won’t produce or needs and new tariffs. There will be ‘deals’ reducing (but not eliminating) individual tariffs with countries committing to reduce trade barriers and import US goods (much of which will never happen).
The pause in reciprocal tariffs, after just one week, was reportedly triggered by the turmoil in bond markets which could have precipitated a financial crisis. Trump has displayed greater resolve in the face of the large fall in equity prices than in his first term. But the risk of a financial crisis, or severe recession, and sharp falls in approval ratings are likely to remain red lines that would result in some pullback.
Challenger expects ongoing tariff uncertainty and hence further volatility in markets. Aggregate tariffs will never get to the levels initially announced, but they will also be much higher than before, reducing US and global growth. Tariffs will add to US inflation, reducing the ability of the Fed to ease. Market pricing is for almost 100 basis points of cuts this year, but there’s a good chance the Fed does not even cut this year.
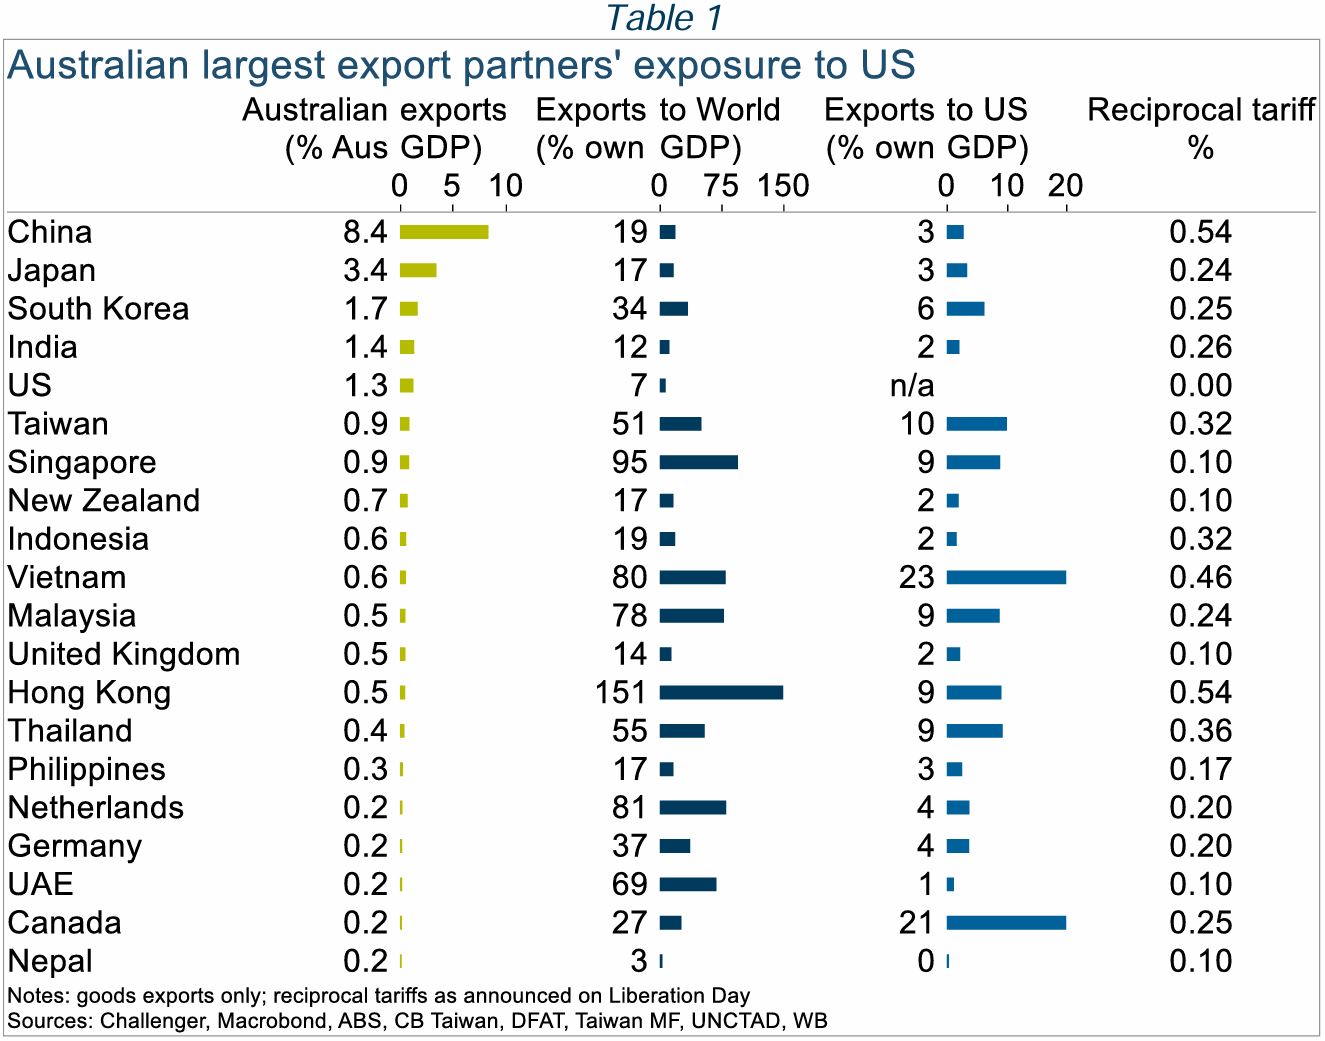
Australia will also see slower growth. We have limited direct exposure to the US economy, but our largest trading partners are more exposed (Table 1). The IMF downgraded its GDP growth forecasts for 2025 by 0.5%. Slower growth, and China’s surplus manufacturing capacity reducing Australian import prices, will lower inflation opening the path to RBA rate cuts. However, market pricing for a cash rate below 3% by December is overdone. With the worst case for US tariffs unlikely to play out, three cuts bringing the cash rate to 3.35%, around its neutral level, seems more likely.
Source: Challenger
Megatrends for 2025 and beyond…
By Robert Wright /February 28,2025/

Megatrends are long-term structural changes that affect the world we live in. Importantly, they shape communities but they also create investment opportunities and risks. Learnings from historical megatrends include: 1) they often solve a problem through innovation; 2) the scope of the megatrend can initially be underestimated; and 3) the duration of a megatrend is typically longer than anticipated. There are numerous megatrends likely to influence markets that investors should consider: the shift to the cloud and generative AI, the ageing population, rising geopolitical tensions and so on. Today we highlight just some of the current megatrends.
The continued growth in “winners take all” dynamics
A megatrend that continues to play out is growth in “winner take all” or at least “winner takes most” dynamics in the global economy. Reduced cross-border frictions, the growth in digital goods and distribution channels, and the increasing importance of scale and network effects have allowed companies to scale to a size almost unimaginable in the past.
The rise of the so called “magnificent seven”, the group of leading US technology companies, is a good example of these forces playing out. This group now accounts for a higher share of global markets than the leading companies of the tech bubble era of the early 2000s. However, unlike that time, their size today has predominantly been fuelled by enormous growth in revenues and profitability, albeit some speculative elements may have played a part more recently.
A key risk for some of these businesses is antitrust. Microsoft, Apple and Alphabet have recently attracted the attention of the antitrust authorities, with increased competition the primary motive. We view that it is a low probability that regulators break up these businesses, meaning the underlying economic forces will continue to allow successful businesses to scale far more quickly and to far larger sizes than historically was the case. This presents a significant opportunity for global investors, as these companies can deliver outsized returns. On the other hand, these trends also increase disruption risks to legacy businesses and industries.
To benefit from the former and guard against the latter, investors should focus on quality companies that have strong and enduring competitive advantages. These advantages typically include scale, pricing power, brand strength, network effects and intellectual property.
Glucagon-like peptide-1s (GLP-1s) and solving obesity
One of the biggest health issues facing developed countries is obesity. The development of the GLP-1 class of weight loss drugs such as Ozempic promises to transform the treatment of obesity and significantly improve health outcomes for societies. GLP-1s stimulate the brain to reduce hunger and act on the stomach to delay emptying, so you feel fuller for longer, have a lower calorie intake and lose weight.
Take up is likely to be strong over coming years as supply constraints ease and continued innovation delivers a more convenient oral pill and mitigates potential side effects such as nausea. Growing clinical evidence of health benefits, such as lower risk of heart problems, will also encourage governments and insurers to cover the cost of the drugs. These developments have dramatically changed the outlook for obesity, with the US recording its first fall in obesity rates since at least the 1970s, a dramatic turnaround from predictions of just a few years ago.
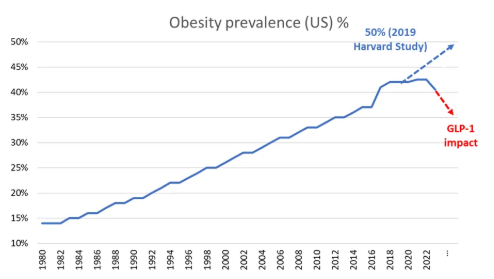
Source: CDC, OECD, WHO, IHME, Harvard
The development also has some significant investment implications. Most obvious are the potential investment opportunities in the drug manufacturers, although given high expectations we need to carefully monitor scientific developments and the pricing environment. There are also several investment risks to consider, with the potential for lower demand for certain medical device companies, food manufacturers and quick service restaurants.
The unrelenting rise in sovereign debt
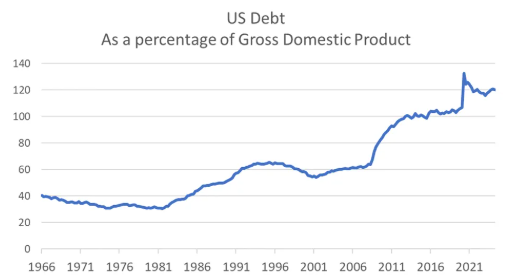
Not all megatrends are positive for investors; one megatrend to be wary of is rising sovereign debt. In many parts of the world fiscal responsibility is no longer a priority as governments focus on more immediate issues and winning elections. In the US the national debt has been rising since the 1980s. In 2010, following the government’s response to the Global Financial Crisis, it first exceeded 90% as a percentage of GDP – the level identified by academics Reinhart and Rogoff as associated with a worsening in growth outcomes. A further spending binge during the 2020 COVID pandemic has resulted in the US national debt rising to more than 120% of GDP.
Source: Federal Reserve Economic Data
With the US Federal budget deficit expected to hit $1.8 trillion in 2024 and both parties promising billions more in spending, debt is likely to continue to build. US national debt has not been a major issue for markets to date, but the risk of a debt crisis, accompanied by rising bond yields and volatile markets, increases as debt levels continue to rise. Many other countries are in a similar position, with debt to GDP exceeding 100% in the UK, France, Spain, Italy and Japan. Australia is relatively well placed with the national debt at 38% of GDP.
What does this mean for investors? Governments have three ways to “solve” excessive national debt: (1) austerity – cutting spending and raising taxes; (2) default; or (3) financial repression – printing money to inflate the problem away. The first is politically unpalatable and appears unlikely, the second would be an outright disaster and can be avoided by countries that issue debt in their own currency such as the US. Thus, the most likely outcome is money printing, or central bank financing of budget deficits in more technical terms, resulting in a period of structurally higher inflation.
While it’s impossible to be precise in terms of the timing of a potential debt crisis, investors can seek to protect themselves by investing in real assets, such as property and equities, with a focus on high quality companies with pricing power that can protect investors in times of high inflation.
These are just a few of the megatrends shaping markets today and in the future. As investors, a long-term focus and active management are key to both taking advantage of the opportunities these trends provide and avoiding risks that may arise.
Source: Magellan
Falling inflation – what does it mean for investors?
By Robert Wright /February 16,2024/

Key points
- Inflation is in retreat thanks to improved supply and cooling demand. A further fall is likely this year.
- Australian inflation remains relatively high – but this mainly reflects lags rather than a more inflation prone economy.
- Profit gouging or wages were not the cause of high inflation.
- The main risks relate to the conflict in the Middle East escalating and adding to supply costs; a surprise rebound in economic activity and sticky services inflation; and floods, the port dispute and poor productivity in Australia.
- Lower inflation should be positive for investors via lower interest rates, although this benefit may come with a lag.
- The world is now a bit more inflation prone so don’t expect a return to near zero interest rates anytime soon.
Introduction
The surge in inflation coming out of the pandemic and its subsequent fall has been the dominant driver of investment markets over the last two years – first depressing shares and bonds in 2022 and then enabling them to rebound. But what’s driving the fall, what are the risks and what does it mean for interest rates and investors? This article looks at the key issues.
Inflation is in retreat
Inflation appears to be falling almost as quickly as it went up. In major developed countries it peaked around 8% to 11% in 2022 and has since fallen to around 3% to 4%. It’s also fallen in emerging countries.

Source: Bloomberg, AMP
What’s driving the fall in inflation?
The rise in inflation got underway in 2021 and reflected a combination of massive monetary and fiscal stimulus that was pumped into economies to protect them through the pandemic lockdowns that was unleashed as spending (first on goods then services) at a time when supply chains were still disrupted. So it was a classic case of too much money (or demand) chasing too few goods and services. Its reversal since 2022 reflects the reversal of policy stimulus as pandemic support measures ended, pent up or excess savings has been run down by key spending groups, monetary policy has gone from easy to tight and supply chain pressures have eased. In particular, global money supply growth which surged in the pandemic has now collapsed.
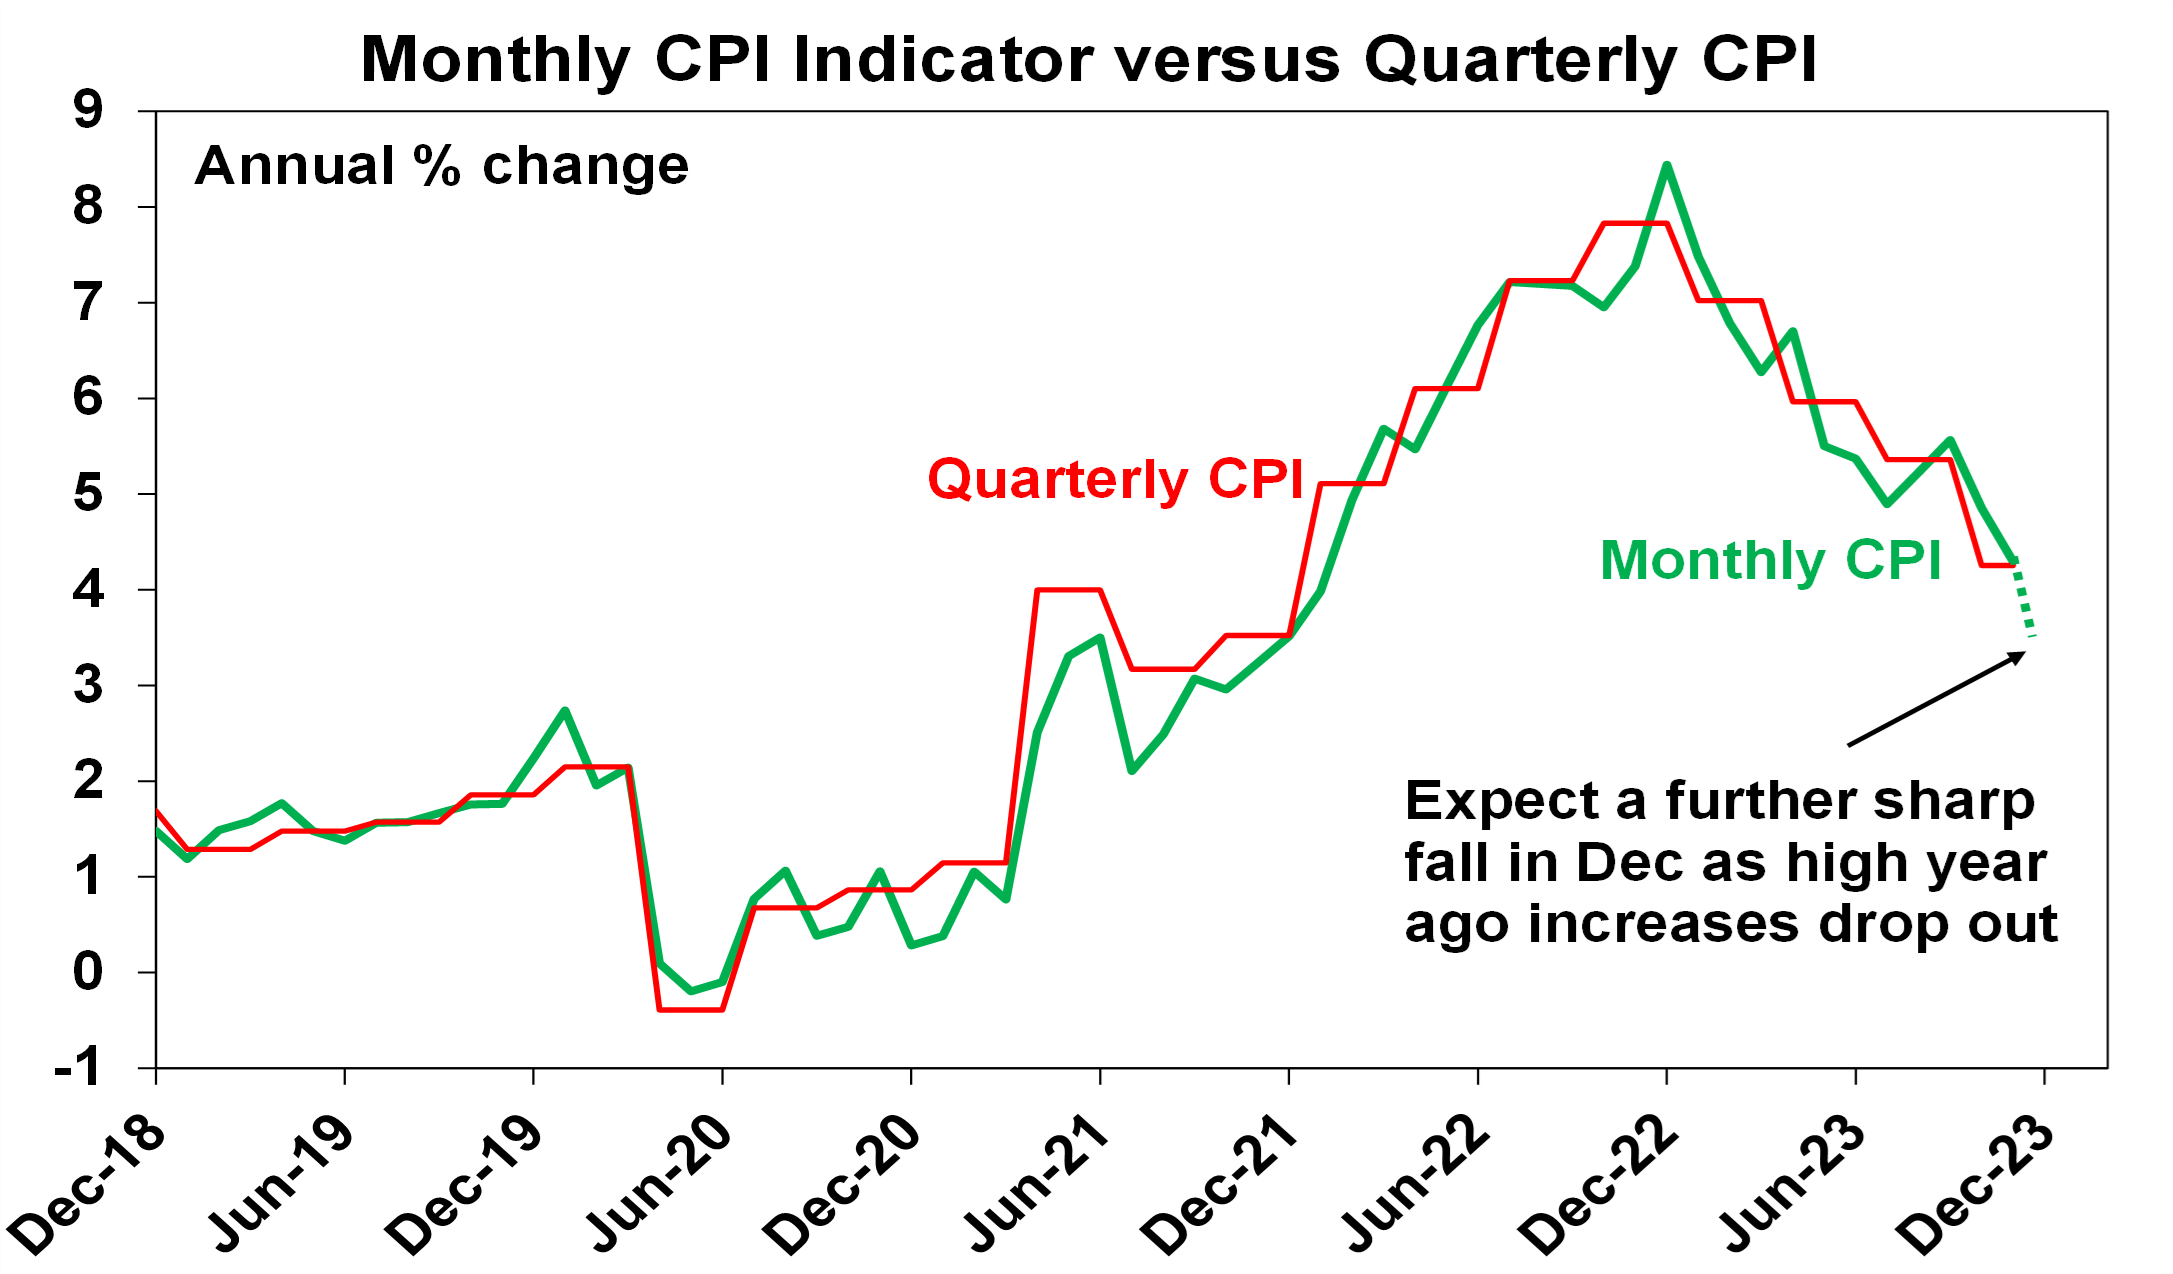
Why is Australian inflation higher than other countries?
While there has been some angst about Australian inflation (at 4.3% year on year in November) being higher than that in the US (3.4%), Canada (3.1%), UK (3.9%) and Europe (2.9%), this mainly reflects the fact that it lagged on the way up and lagged by around 3 to 6 months at the top. The lag partly reflects the slower reopening from the pandemic in Australia and the slower pass through of higher electricity prices. So we saw inflation peak in December 2022, whereas the US, for instance, peaked in June 2022. But just as it lagged on the way up it’s still following other countries down with roughly the same lag. In fact, with a very high 1.5% month on month implied rise in the Monthly CPI Indicator to drop out from December last year, monthly CPI inflation is likely to have dropped to around 3.3% to 3.7% year on year in December last year, which is more in line with other countries.
Source: Bloomberg, AMP
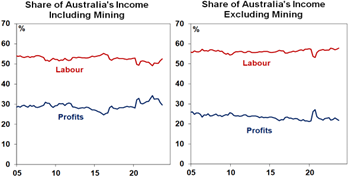
What about profit gouging?
There has been some concern that the surge in prices is due to “price gouging” with “billion dollar profits” cited as evidence. In fact, the Australian Government has set up an inquiry into supermarket pricing. There are several points to note in relation to this. First, it’s perfectly normal for any business to respond to an increase in demand relative to supply by raising prices. Even workers do this (e.g. asking for a pay rise and leaving if they don’t get one when they are getting lots of calls from headhunters). It’s the way the price mechanism works in allocating scarce resources. Second, national accounts data don’t show any underlying surge in the profit share of national income, outside of the mining sector. Finally, blaming either business or labour (with wages growth picking up) risks focusing on the symptoms of high inflation not the fundamental cause, which was the pandemic driven policy stimulus and supply disruption. This is not to say that corporate competition can’t be improved.
Source: ABS, RBA, AMP
What is the outlook for inflation?
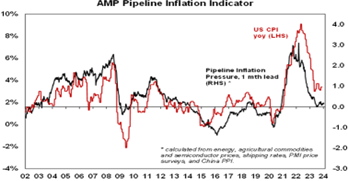
Our US and Australian Pipeline Inflation Indicators continue to point to a further fall in inflation ahead.
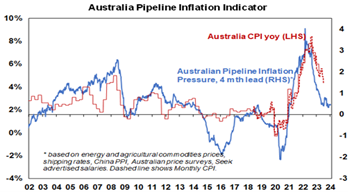
Source: Bloomberg, AMP
This is consistent with easing supply pressures, lower commodity prices and slowing demand. It’s not assuming recession, but it is a high risk and if that occurred it would likely result in inflation falling below central bank targets. Out of interest, the six month annualised rate of core private final consumption inflation in the US, which is what the Fed targets, has fallen below its 2% inflation target. In Australia, it’s expected that the quarterly CPI inflation to have fallen to around 3% year on year by year end. The return to the top of the 2% to 3% target is expected to come around one year ahead of the RBA’s latest forecasts.
What are the risks?
Of course, the decline in inflation is likely to be bumpy and some say that the “last mile” of returning it to target might be the hardest. There are five key risks to keep an eye on in terms of inflation:
- First, the escalating conflict in the Middle East has the potential to result in inflationary pressures. Disruption to Red Sea/Suez Canal shipping is already adding to container shipping rates due to extra time in travelling around Africa. So far this has seen only a partial reversal of the improvement in shipping costs seen since 2022 and commodity prices and the oil price remain down. The US and its allies are likely to secure the route relatively quickly such that any inflation boost is short lived. The real risk though, is if Iran is drawn directly into the conflict, threatening global oil supplies.
- Economic activity could surprise on the upside again keeping labour markets tight, fuelling prices and wages, and hence sticky services inflation.
- Central banks could ease before inflation has well and truly come under control in a re-run of the stop/go monetary policy of the 1970s.
- In Australia, recent flooding could boost food prices and delays associated with industrial disputes at ports could add to goods prices. At present though, the floods are not on the scale of those seen in 2022 and it’s expected that any impact from both to be modest (at say 0.2%).
- Finally, and also in Australia if productivity remains depressed, 4% wages growth won’t be consistent with the 2% to 3% inflation target.
What lower inflation means for investors?
High inflation tends to be bad for investment markets because it means higher interest rates; higher economic uncertainty; and for shares, a reduced quality of earnings. All of which means that shares tend to trade on lower price to earnings multiples when inflation is high, and growth assets trade on higher income yields. We saw this in 2022 with bond yields surging, share markets falling and other growth assets pressured.

Source: Bloomberg, AMP
So, with inflation falling, much of this goes in reverse as we started to see in the last few months. In particular:
- Interest rates will start to come down. The Fed is expected to start cutting in May and the European Central Bank (ECB) to start cutting around April, both with 5 cuts this year. There is some chance that both could start cutting in March. The RBA is expected to start cutting around June, with 3 cuts this year.
- Shares can potentially trade on higher price-to-earnings (PEs) than otherwise.
- Lower interest rates with a lag are likely to provide some support for real assets like property.
Of course, the main risk is if economies slide into recession, which will mean another leg down in share markets before they start to benefit from lower interest rates. This is not our base case but it’s a high risk.
Concluding comment
Finally, while inflation is on the mend cyclically, it’s worth remembering that from a longer term perspective we have likely now entered a more inflation prone world than the one prior to the pandemic, reflecting bigger government; the reversal of globalisation; increasing defence spending; decarbonisation; less workers and more consumers as populations age. So short of a very deep recession, don’t expect interest rates to go back to anywhere near zero anytime soon.
Source: AMP
Where is the Recession?
By Robert Wright /May 19,2023/

Key points
- A progress report on inflation: Inflation appears to have peaked, led by improvements in core goods prices and rate sensitive sectors like housing. The policy focus has shifted to labour market normalisation where early signs of progress are emerging.
- Is a soft landing in sight? The Fed remains committed to doing “whatever it takes” to bring inflation to the targeted level. Despite the aggressive tightening we’ve seen so far, alternative data indicators suggest that the economy remains on relatively solid footing.
- Equity market positioning: We are positioned for themes of continued high rates, improving sentiment outside the US and a potential soft economic landing. This is expressed with a preference for value particularly in cyclical sectors including capital goods, consumer durables, autos and airlines.
2022 was a year where extreme macroeconomic and geopolitical events shaped market behaviour. The US Consumer Price Index (CPI) peaked at 9.1%, the highest level in over 40 years. The subsequent policy response saw the US Federal Reserve (Fed) deliver 4.25% of rate hikes across only seven meetings. This was the fastest cycle of rate hikes since the early 1980s, a period of stubborn inflation and aggressive policy action that ultimately ended in a recession.
As we begin 2023, there’s a greater level of clarity around some of the questions that have driven markets over the last year. Recent inflationary data shows improvements in the trajectory of core goods prices and rate sensitive components. Now, the focus of policymakers has shifted towards restoring balance in the labour market and doing “whatever it takes” to bring inflation to the targeted level. As we enter a new phase of tightening beyond peak price pressures, what does alternative data reveal about the path of inflation and the recession that so many are expecting?
A progress report on inflation
In the final months of 2022, long awaited improvements in the trajectory of inflation began to surface. Figure 1 shows the widening gap between current reported inflation and where US CPI is expected to stand in six months based on a broad range of leading economic indicators and text mined commentary on inflation. Peak inflation seems to be behind us and a clearer path towards meeting central bank objectives has started to appear. As observed in the inflation GPS measure, the sentiment of corporate comments around cost pressures and the effects of inflation on margins hasn’t showed signs of deteriorating as the outlook improves.
Figure 1: US Inflation GPS shows continued decline in the trajectory of consumer prices
Current US Inflation vs six month inflation expectations

Source: Refinitiv DataStream, chart by the BlackRock Investment Institute, December 2022. The BlackRock Inflation GPS shows where core (excluding food and energy) consumer price inflation may stand in six months’ time. The GPS models the relationship between rates of core inflation and a broad set of economic indicators including measures of slack, inflation expectations, and other inflation related data such as business surveys and wages. It also incorporates a proprietary Systematic Active Equity signal measured through text mining of commentary on inflation.
Core goods prices, where the initial surge in inflation was the most robust, are showing significant progress. This has continued to play out with the shift in spending from goods to services throughout the economic reopening and the healing of supply chain bottlenecks. Figure 2 shows average freight transportation costs which have fallen back to pre pandemic levels. These costs were previously 14 times greater during the peak of supply chain issues.
Figure 2: Global supply chains have mostly recovered with shipping costs returning to pre COVID levels
Average freight costs for shipping a 40ft container

Source: BlackRock, with data from Bloomberg, as of January 2023. All amounts in USD.
Shelter is another category where alternative data is pointing to a clear disinflationary trend throughout 2023. Shown in Figure 3, the growth rate of new online rental listings in the US has started to decline. The Owners’ Equivalent Rent (OER) component of CPI which captures both new and continuing leases tends to lag this alternative rental data by 6 to 9 months. This suggests that the trend we’re seeing in new leases will increasingly impact CPI data as the year goes on.
Figure 3: The growth rate of new rental leases has started to decline, a trend that will increasingly impact CPI data
Online new rental leases vs. Owners’ Equivalent Rent (OER)

Source: BlackRock, with data from Apartment List and Zillow, January 2023.
For the next phase of the tightening cycle, Fed officials have shifted their focus to labour markets. Wages have remained a persistent driver of broad-based services inflation since the economic reopening began. Historical periods of inflation have shown that reining in wage inflation is a critical step in restoring price stability and preventing long-run expectations from becoming unanchored. In early November, Fed Chairman Jerome Powell identified 3.5% wage growth as a targeted level that would be consistent with the Fed’s 2% inflation objective.
To monitor the trajectory of wage growth, we use online job postings in the US for a real time view of employment cost data ahead of official releases (Figure 4). Wage growth has started to moderate in recent months and shows signs that the labour market is finally beginning to cool. However, more progress is needed to reach the Fed’s target especially in the services sector where inflationary pressures remain the most stubborn.
Figure 4: Wage growth is showing signs of moderating, but more progress is needed
Year over year wage growth for goods vs services roles

Source: BlackRock, with data from Burning Glass Technologies, as of January 2023.
Is a soft landing in sight?
The likelihood of a soft vs hard landing depends on how healthy the economy remains as inflation continues to normalize and how policymakers react to ongoing developments. So what does the data tell us about where the economy is heading?
Let’s first examine the underlying drivers of the readjustment that’s taking place in labour markets. Following COVID-19, a labour shortage emerged as many individuals didn’t immediately return to the workforce. Simultaneously, the economic reopening drove robust demand for workers and a significant increase in job openings, many of which remained vacant due to labour supply constraints. As a result, the recent normalisation in labour markets and wages has mostly come from a decrease in job openings. This differs from past periods of inflation where monetary tightening caused severe job losses and high unemployment that ultimately ended in a recession.
Figure 5 shows the decline that we’ve seen in the number of online job postings as labour demand falls. Most of the pullback in job postings is concentrated in the technology sector. This is also the case for layoffs which remain extremely benign across the broader economy. Importantly, job openings remain elevated in aggregate relative to pre COVID, suggesting that the gap between labour demand and supply can continue to narrow through a decline in job openings rather than severe layoffs.
Figure 5: Falling labour demand has come through declines in job openings, not layoffs
Volume of online job postings normalised to 2020 levels

Source: BlackRock, with data from Indeed.com, as of January 2023.
Along with company behaviour, we’re closely monitoring consumer activity for signs of weakness. Figure 6 shows US inflation adjusted consumer spending in the services sector which remains relatively stable and above pre COVID levels despite starting to decline particularly for the lowest income cohort. How has this level of consumer activity been sustainable as savings rates have fallen to historical lows amid higher interest rates? The previous period of unprecedented fiscal stimulus throughout the pandemic has kept the total level of household savings in excess, even long after stimulus payments have tapered off. Furthermore, household interest payments remain well below the pre COVID trend with less debt on consumer balance sheets. The combination of sustained excess savings, lower debt levels, and muted layoff activity has allowed consumer spending to remain relatively resilient over the course of the Fed’s tightening cycle.
Figure 6: US Services spending remains above 2019 levels despite signs of weakness
3Y Discretionary service consumption by income cohort adjusted for inflation
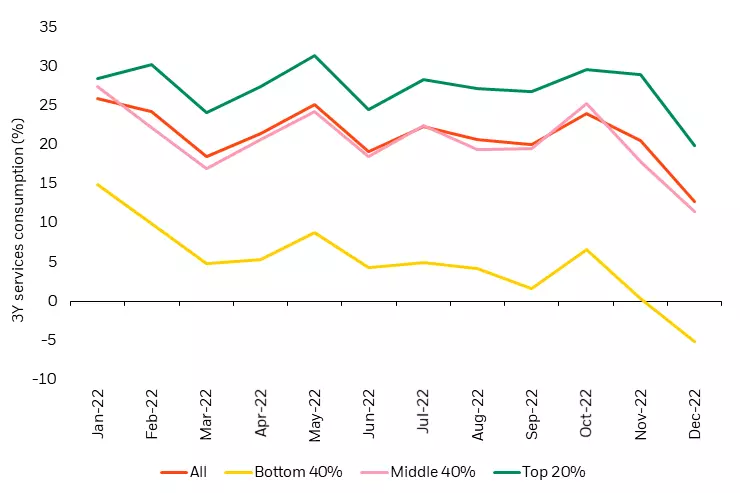
Source: BlackRock, Yodlee/ConsumerEdge, Earnest Research, as of December 2022.
Alternative data reveals an improving picture for inflation, orderly rebalancing of the labour market and a relatively healthy consumer – each currently more supportive of the case for a soft landing than a hard landing.
Market pricing has increasingly shifted towards the expectation for interest rate cuts by the end of 2023 (Figure 7). This can be supported by two opposing viewpoints: 1) the hard landing scenario which expects policymakers to overtighten and engineer a recession, or 2) a scenario where inflation swiftly returns to the 2% target and the Fed is able to begin easing financial conditions. In our view, both of these scenarios are unrealistic. Instead, we believe rates will remain higher for longer rather than a near term policy pivot. Today’s relatively stable economy may remain more resilient to high rates and policymakers are likely to delay easing financial conditions due to the lingering effects of two years of excessive inflation.
Figure 7: Market is currently pricing in rate cuts by the end of 2023
Market implied policy rates

Source: BlackRock, with data from Bloomberg, as of January 19, 2023.
Equity market positioning for Q1, 2023
After a challenging year for equity markets in 2022, the downward trajectory of inflation and continued economic stability point to a slightly more positive outlook in the coming months. How are these insights shaping our positioning across the global equity landscape?
An expanding global opportunity set
Like the US, the outlook for Europe has started to improve despite core inflation remaining at record highs. A warmer than expected winter has relieved some of the pressure from the energy crisis. Wage growth has also started to come down in Europe as labour markets normalise at an even faster pace than in the US. In China, the economic reopening has quickly taken off. Along with relaxed COVID-19 restrictions, there’s been an easing in common prosperity and antimonopoly regulations. This is an added tailwind to the improving sentiment towards Chinese assets, particularly in sectors like education, internet and real estate that were most impacted by these regulatory initiatives.
Sector positioning for a potential soft landing
Our global portfolios maintain a preference for value vs growth based on continued themes of high rates and inflation followed by a potential soft landing. Notably, we’ve seen a shift in the underlying sectors driving the top down leadership of value. What was previously led by the energy sector has shifted to favour cyclical sectors that have been heavily discounted over the last year, including capital goods, consumer durables, autos and airlines where we’re currently overweight. These are well positioned for a continued high interest rate environment where the economy ultimately avoids a deep recession.
Conclusion
As we enter the next phase in the fight against inflation, market focus has shifted to whether policymakers can achieve a durable decline in inflation without causing a recession. Using alternative data to cut through the noise of hard vs soft landing speculation, we see signs of progress in restoring price stability while maintaining economic strength. At the same time, macroeconomic uncertainty remains high and we expect market volatility to persist as conditions evolve. This makes a data centric investment approach crucial to navigating today’s complex environment, allowing us to remain nimble as investors during a time where dynamism matters most.
Source: BlackRock