
Tag Archives: Inflation
Seven lasting impacts from the COVID pandemic
By Robert Wright /May 28,2024/

Key points
- Seven key lasting impacts from the Coronavirus pandemic are: “bigger” government; tighter labour markets; reduced globalisation and increased geopolitical tensions; higher inflation; worse housing affordability; working from home; and a faster embrace of technology.
- On balance these make for a more fragmented and volatile world for investment returns. But it’s not all negative.
Introduction
It’s four years since the COVID lockdowns started. The pandemic ended when it morphed into the less deadly Omicron variant in late 2021, but just as a sound can reverberate around a room the effects of the pandemic continue to reverberate in economies. Putting aside the long-term health impacts this note looks at 7 key lasting economic impacts.
- Bigger government and more public debt
The malaise of the 1970s ushered in “smaller” government in the 1980s in the Thatcher, Reagan, Hawke and Keating era. But the political pendulum started to swing back to “bigger” government after the GFC and COVID has given it another push. Memories of the problems of high government intervention in the 1970s have faded and there is rising support for the view that government is the solution to most problems – via regulation, taxes, spending or education campaigns. The pandemic added to support for “bigger” government: by showcasing the power of government to protect households and businesses from shocks; enhancing perceptions of inequality; and adding support to the view that governments should ensure supply chains by bringing production back home. It’s combining with a desire for governments to pick and subsidise clean energy “winners”.

Source: IMF, Australian Government, AMP
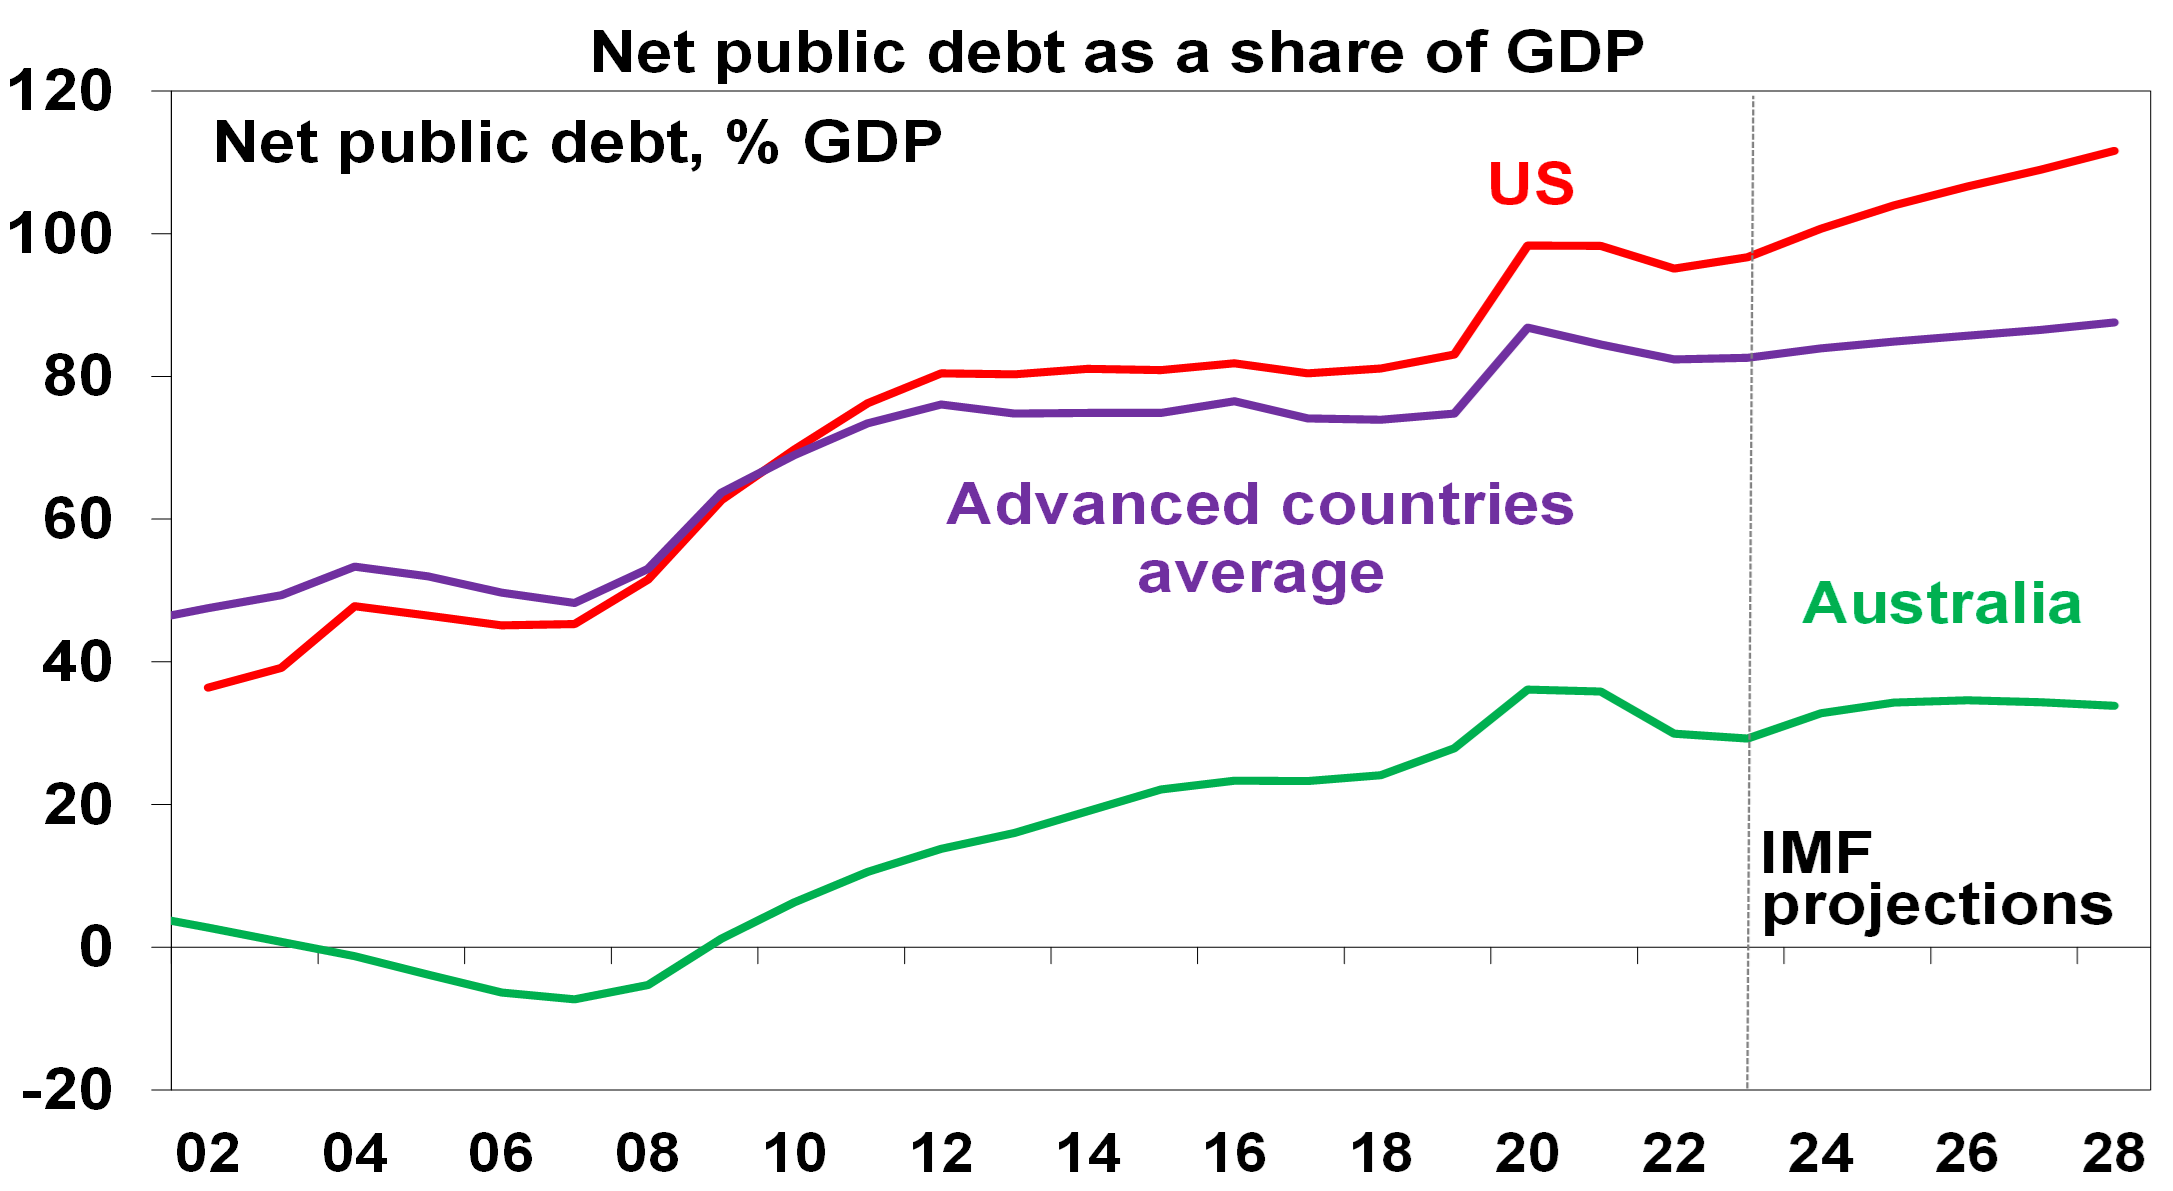
IMF projections for government spending in advanced countries show it settling nearly 2% of GDP higher than pre-COVID levels. The success of governments in protecting households from the worst of the pandemic has also reinforced expectations they would do the same in the next crisis. The pandemic ushered in even bigger public debt just as the GFC did. While high inflation helped lower debt to GDP ratios in 2022 it’s settling at higher levels than pre-pandemic.
Source: IMF, AMP
Implications – While there may initially be a feel good factor, the long-term outcome of “bigger” government is likely to be less productive economies, lower than otherwise living standards and less personal freedom. It will take time before this becomes apparent though. Meanwhile, higher public debt means: less flexibility to respond with fiscal stimulus to a crisis; a greater incentive for politicians to inflate their way out; and interest payments being a high share of tax revenue.
- Tighter labour markets and faster wages growth
In the pre-pandemic years, wages growth was relatively low and a key driver was high levels of underemployment, particularly evident in Australia. After the pandemic, labour markets have tightened reflecting the rebound in demand post pandemic, lower participation rates in some countries and a degree of labour hoarding as labour shortages made companies reluctant to let workers go. As a result, wages growth increased, possibly breaking the pre-pandemic malaise of weak wages growth.

Source: ABS, AMP
Implications – Tighter labour markets run the risk that wages growth exceeds levels consistent with 2% to 3% inflation.
- Reduced globalisation/more geopolitical tensions
A backlash against globalisation became evident last decade in the rise of Trump, Brexit and populist leaders pushing a nationalist gender when the benefits of free trade were being questioned. Also, geopolitical tensions were on the rise with the relative decline of the US and faith in liberal democracies waning resulting in a shift from a unipolar world dominated by the US, to a multipolar world as regional powers (Russia, Iran, Saudi Arabia and notably China) flexed their muscles. The pandemic inflamed both – with supply side disruptions adding to pressure for the onshoring of production; conflict over the source of and management of coronavirus; it heightened tensions between the west and China; and it appears to have added to nationalism and populism. So, the days of global free trade agreements and falling defence spending seem long gone for now. Rather we are seeing more protectionism (e.g. with subsidies and regulation favouring local production) and increased defence spending.
Implications – Reduced globalisation risks leading to reduced potential economic growth for the emerging world and reduced productivity if supply chains are managed on other than economic grounds. And combined with increased geopolitical tensions resulting in more defence spending it could result in a more inflation prone world than was the case.
- Higher prices, inflation and interest rates
A big downside of the pandemic support programs was the surge in inflation. The combination of massive money printing along with a big increase in government payments to households (e.g. Job Keeper) resulted in a massive boost to spending once lockdowns were lifted which combined with supply chain disruptions, also flowing from the pandemic, to cause a surge in inflation. Inflation is now starting to come under control as the monetary easing and spending boost has been reversed and supply has improved again but the pandemic has likely ushered in a more inflation prone world by boosting “bigger” government; adding to a reversal in globalisation; and adding to geopolitical tensions. All of which combine with aging populations to potentially result in more inflation.
Implications – Higher inflation than seen pre-pandemic means higher than otherwise interest rates over the medium term which reduces the upside potential for growth assets like shares and property.
- Worse housing affordability
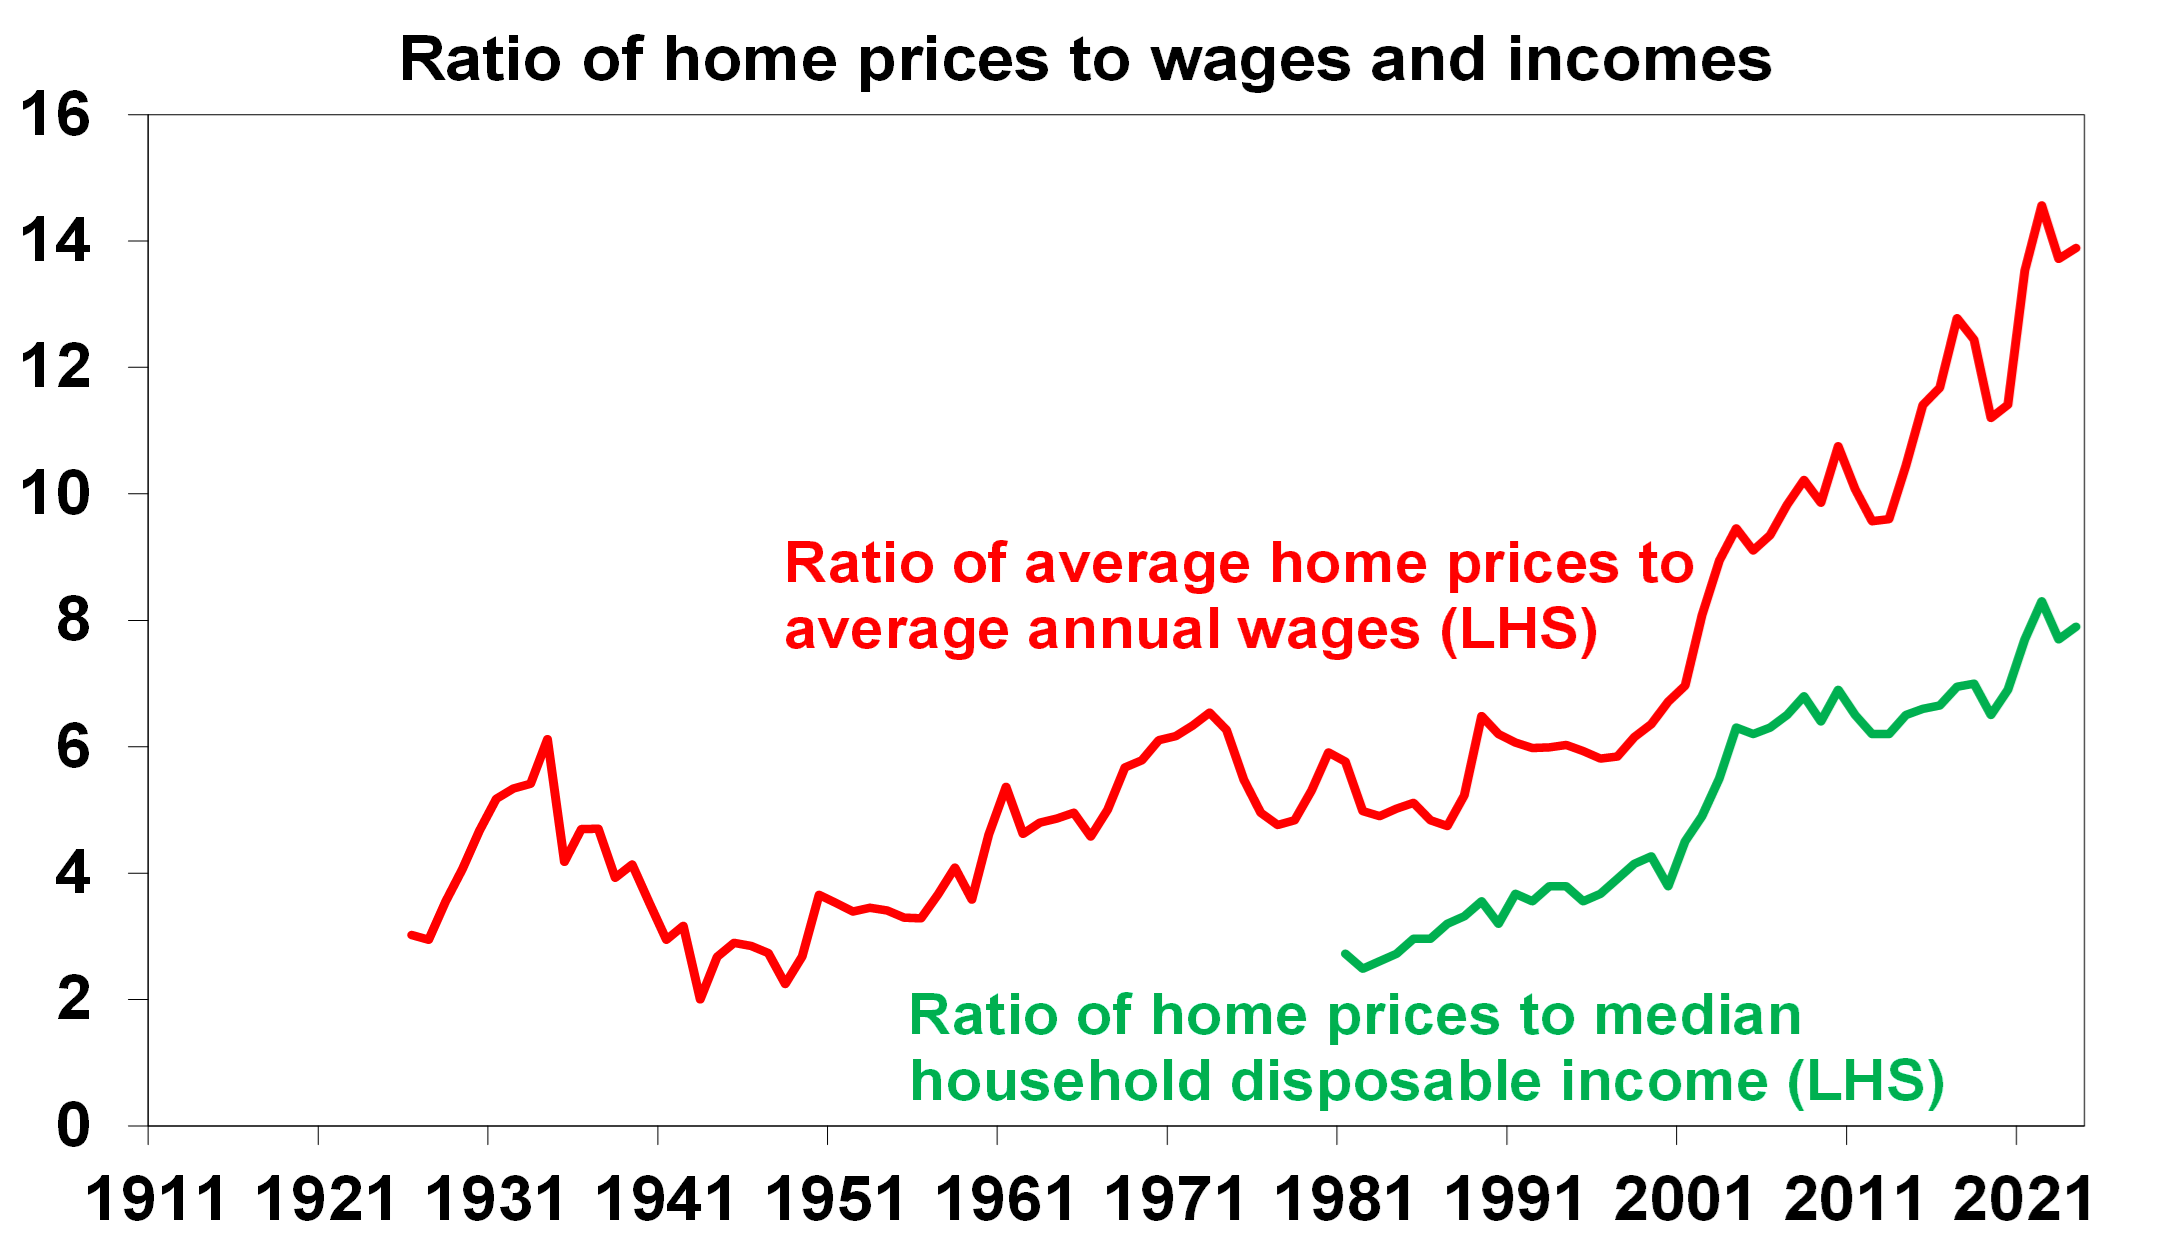
At the start of the pandemic, it was thought the economic downturn and higher unemployment and a freeze in immigration would cause a collapse in home prices and they did initially fall. But not by much as it was quickly turned around by policy measures to support household income, allow a pause in mortgage payments and slash interest rates and mortgage rates to record lows. What’s more the lockdowns and working from home drove increased demand for houses over units and interest in smaller cities and regional locations. As a result, Australian home prices surged to record levels. Meanwhile the impact of higher interest rates in the last two years on home prices was swamped by housing shortages as immigration surged in a catch up. The end result is now record low levels of housing affordability for buyers (who are hit by a double whammy of higher prices relative to incomes – see the next chart – and higher mortgages rates) and renters (who have seen surging rents).
Source: ABS, CoreLogic, AMP
Implications – Ever worse housing affordability means ongoing intergenerational inequality and even higher household debt.
- Working from home likely here to stay
While there has been a return to the office, for many its only two or three days a week. Basically, the lockdowns resulted in a step jump towards working from home (WFH). A UK study of over 2000 firms is indicative. It showed that while around 90.8% of employees were fully onsite in 2018, last year this had fallen to 62.3%, with 30.2% with hybrid (working in the office and at home) arrangements. Similarly, the ABS found 37% of employed people in Australia regularly worked from home. Of course, this masks a huge range with industries with a high proportion of computer-based workers having more hours working at home. And firms expect this to remain the case. There are huge benefits to physically working together around culture, collaboration, idea generation and learning but there are also benefits to working from home with no commute time, greater focus, less damage to the environment, better life balance and for companies – lower costs, more diverse workforces and happier staff. So the ideal is probably a hybrid model. The proportion of workers in a hybrid model may even rise as new firms are quicker to embrace WFH.
Working arrangements for UK employees

Source: K Shah, and others, Managers say working from home here to stay, CEPR
Implications – Less office space demand as leases expire resulting in higher vacancy rates/lower rents, more people living in cities as vacated office space is converted and reinvigorated life in suburbs and regions.
- Faster embrace of technology
Lockdowns dramatically accelerated the move to a digital world. Everyone was forced to embrace new online ways of doing things. Many have now embraced online retail, working from home and virtual meetings. It may be argued that this fuller embrace of technology will enable the full productivity enhancing potential of technology to be unleased. The rapid adoption of AI will likely help.
Implications – This has meant a faster embrace of online retailing (up from 7% of retailing pre-pandemic to around 11%) at the expense of traditional retailing, virtual meeting attendance becoming the norm for many (even in the office) and business travel settling at a lower level.
Concluding comments
Perhaps the biggest impact is that the pandemic related stimulus broke the back of the ultra-low inflation seen pre-pandemic. Together with bigger government and reduced globalisation, this means a more inflation-prone world. So, a return to pre-pandemic ultra-low inflation and interest rates looks unlikely. It’s not all negative though – apart from the faster technology uptake, the global and Australian economies have come through the last four years in far better shape than might have been imagined at the start of the lockdowns!
Source: AMP
Falling inflation – what does it mean for investors?
By Robert Wright /February 16,2024/

Key points
- Inflation is in retreat thanks to improved supply and cooling demand. A further fall is likely this year.
- Australian inflation remains relatively high – but this mainly reflects lags rather than a more inflation prone economy.
- Profit gouging or wages were not the cause of high inflation.
- The main risks relate to the conflict in the Middle East escalating and adding to supply costs; a surprise rebound in economic activity and sticky services inflation; and floods, the port dispute and poor productivity in Australia.
- Lower inflation should be positive for investors via lower interest rates, although this benefit may come with a lag.
- The world is now a bit more inflation prone so don’t expect a return to near zero interest rates anytime soon.
Introduction
The surge in inflation coming out of the pandemic and its subsequent fall has been the dominant driver of investment markets over the last two years – first depressing shares and bonds in 2022 and then enabling them to rebound. But what’s driving the fall, what are the risks and what does it mean for interest rates and investors? This article looks at the key issues.
Inflation is in retreat
Inflation appears to be falling almost as quickly as it went up. In major developed countries it peaked around 8% to 11% in 2022 and has since fallen to around 3% to 4%. It’s also fallen in emerging countries.

Source: Bloomberg, AMP
What’s driving the fall in inflation?
The rise in inflation got underway in 2021 and reflected a combination of massive monetary and fiscal stimulus that was pumped into economies to protect them through the pandemic lockdowns that was unleashed as spending (first on goods then services) at a time when supply chains were still disrupted. So it was a classic case of too much money (or demand) chasing too few goods and services. Its reversal since 2022 reflects the reversal of policy stimulus as pandemic support measures ended, pent up or excess savings has been run down by key spending groups, monetary policy has gone from easy to tight and supply chain pressures have eased. In particular, global money supply growth which surged in the pandemic has now collapsed.
Why is Australian inflation higher than other countries?
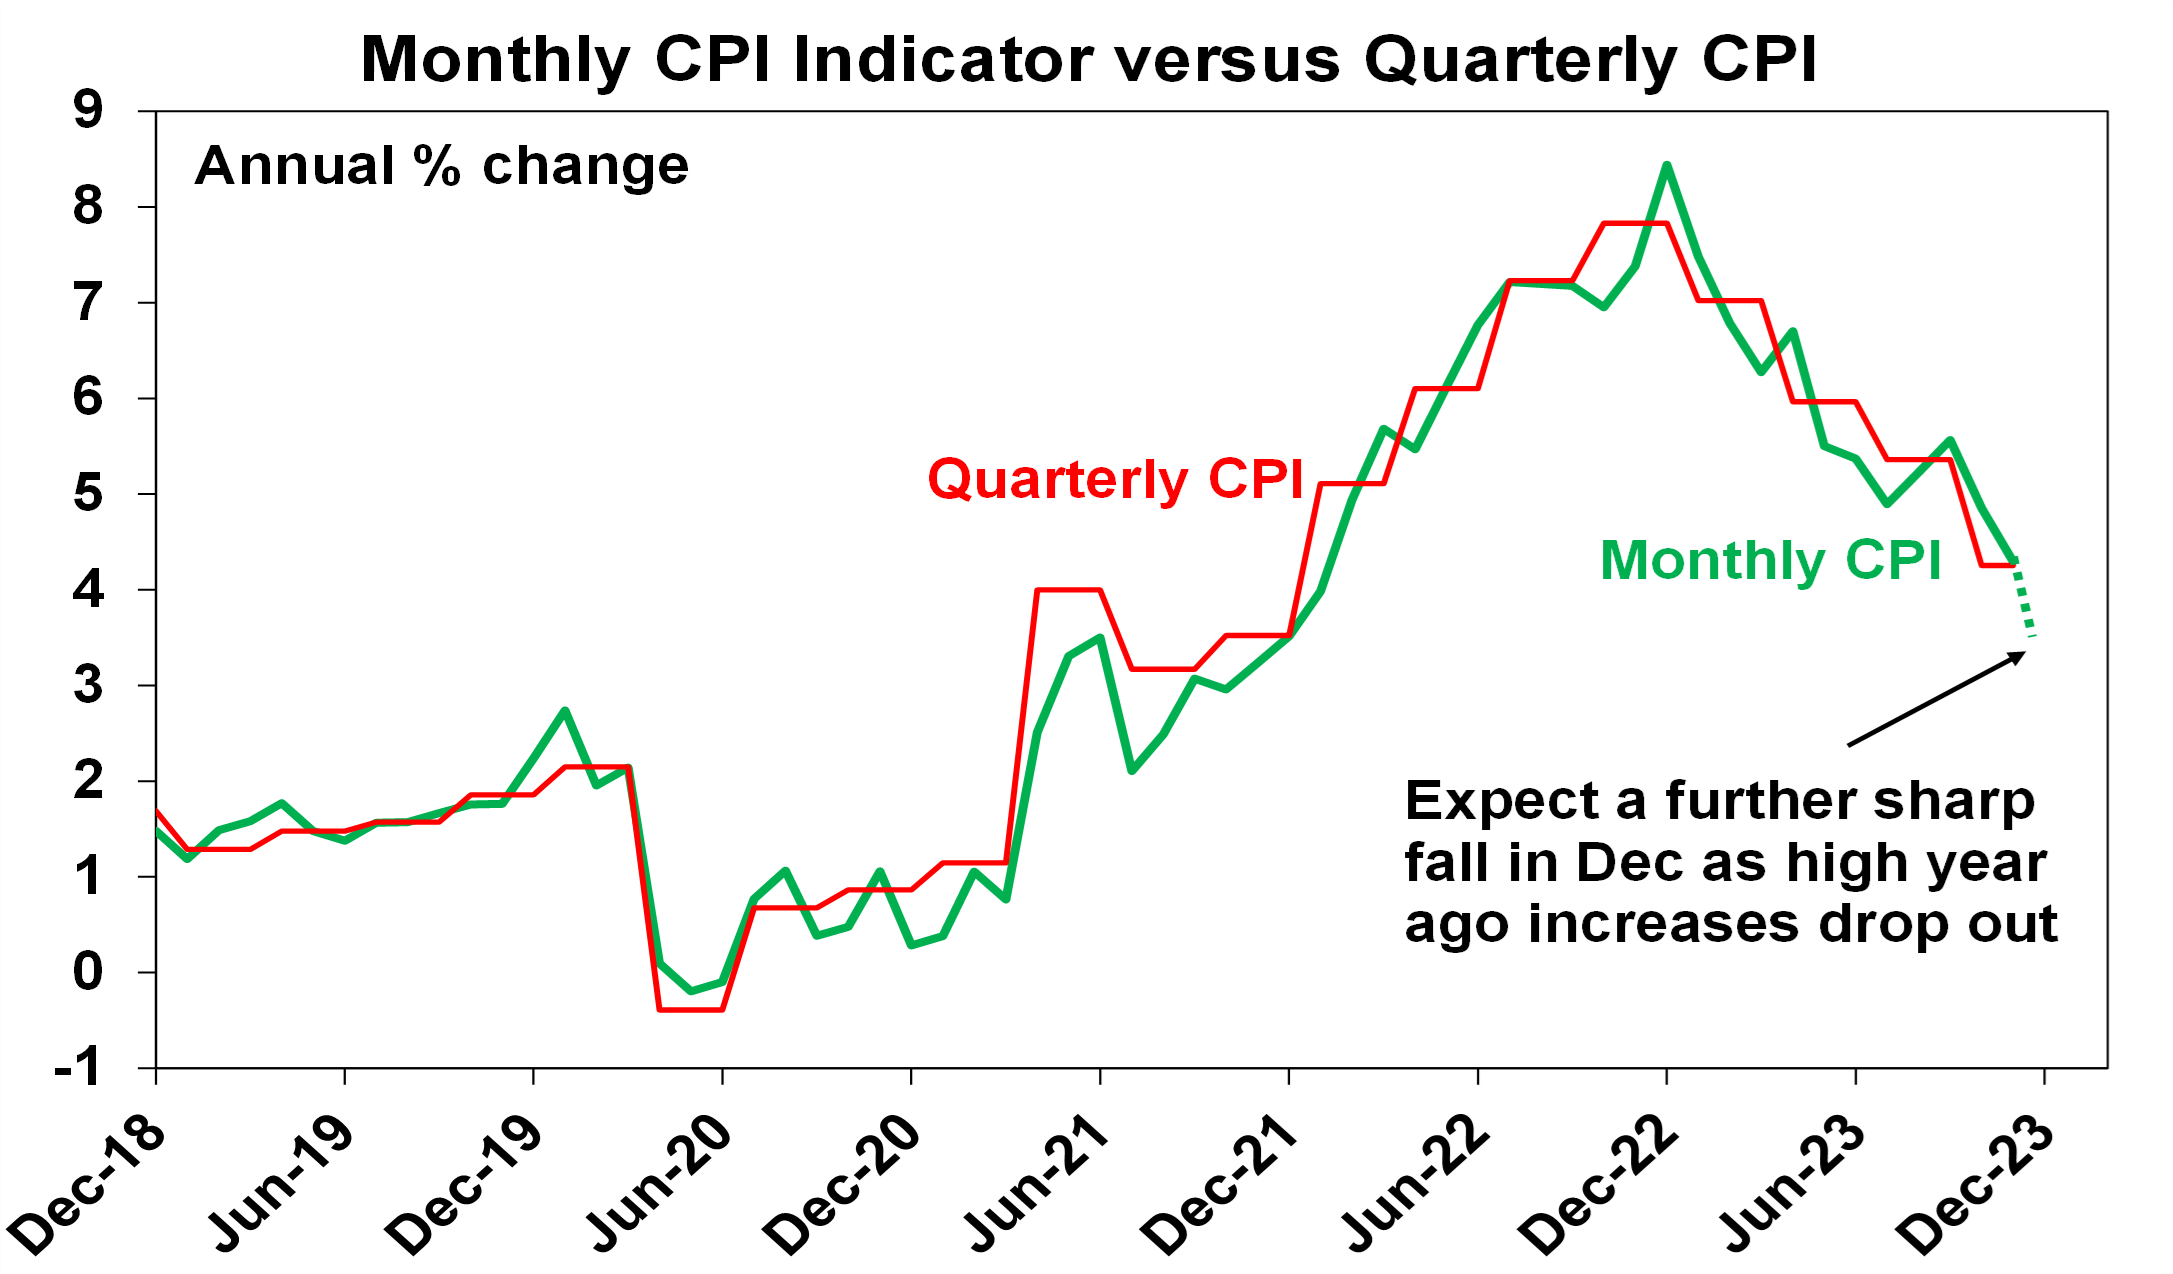
While there has been some angst about Australian inflation (at 4.3% year on year in November) being higher than that in the US (3.4%), Canada (3.1%), UK (3.9%) and Europe (2.9%), this mainly reflects the fact that it lagged on the way up and lagged by around 3 to 6 months at the top. The lag partly reflects the slower reopening from the pandemic in Australia and the slower pass through of higher electricity prices. So we saw inflation peak in December 2022, whereas the US, for instance, peaked in June 2022. But just as it lagged on the way up it’s still following other countries down with roughly the same lag. In fact, with a very high 1.5% month on month implied rise in the Monthly CPI Indicator to drop out from December last year, monthly CPI inflation is likely to have dropped to around 3.3% to 3.7% year on year in December last year, which is more in line with other countries.
Source: Bloomberg, AMP
What about profit gouging?
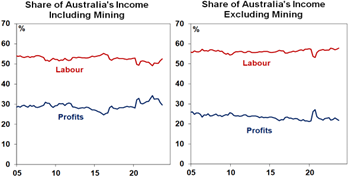
There has been some concern that the surge in prices is due to “price gouging” with “billion dollar profits” cited as evidence. In fact, the Australian Government has set up an inquiry into supermarket pricing. There are several points to note in relation to this. First, it’s perfectly normal for any business to respond to an increase in demand relative to supply by raising prices. Even workers do this (e.g. asking for a pay rise and leaving if they don’t get one when they are getting lots of calls from headhunters). It’s the way the price mechanism works in allocating scarce resources. Second, national accounts data don’t show any underlying surge in the profit share of national income, outside of the mining sector. Finally, blaming either business or labour (with wages growth picking up) risks focusing on the symptoms of high inflation not the fundamental cause, which was the pandemic driven policy stimulus and supply disruption. This is not to say that corporate competition can’t be improved.
Source: ABS, RBA, AMP
What is the outlook for inflation?
Our US and Australian Pipeline Inflation Indicators continue to point to a further fall in inflation ahead.
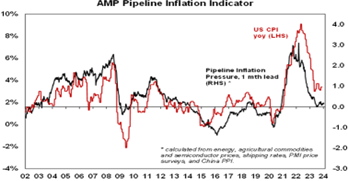
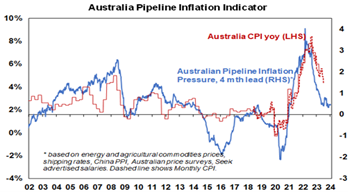
Source: Bloomberg, AMP
This is consistent with easing supply pressures, lower commodity prices and slowing demand. It’s not assuming recession, but it is a high risk and if that occurred it would likely result in inflation falling below central bank targets. Out of interest, the six month annualised rate of core private final consumption inflation in the US, which is what the Fed targets, has fallen below its 2% inflation target. In Australia, it’s expected that the quarterly CPI inflation to have fallen to around 3% year on year by year end. The return to the top of the 2% to 3% target is expected to come around one year ahead of the RBA’s latest forecasts.
What are the risks?
Of course, the decline in inflation is likely to be bumpy and some say that the “last mile” of returning it to target might be the hardest. There are five key risks to keep an eye on in terms of inflation:
- First, the escalating conflict in the Middle East has the potential to result in inflationary pressures. Disruption to Red Sea/Suez Canal shipping is already adding to container shipping rates due to extra time in travelling around Africa. So far this has seen only a partial reversal of the improvement in shipping costs seen since 2022 and commodity prices and the oil price remain down. The US and its allies are likely to secure the route relatively quickly such that any inflation boost is short lived. The real risk though, is if Iran is drawn directly into the conflict, threatening global oil supplies.
- Economic activity could surprise on the upside again keeping labour markets tight, fuelling prices and wages, and hence sticky services inflation.
- Central banks could ease before inflation has well and truly come under control in a re-run of the stop/go monetary policy of the 1970s.
- In Australia, recent flooding could boost food prices and delays associated with industrial disputes at ports could add to goods prices. At present though, the floods are not on the scale of those seen in 2022 and it’s expected that any impact from both to be modest (at say 0.2%).
- Finally, and also in Australia if productivity remains depressed, 4% wages growth won’t be consistent with the 2% to 3% inflation target.
What lower inflation means for investors?
High inflation tends to be bad for investment markets because it means higher interest rates; higher economic uncertainty; and for shares, a reduced quality of earnings. All of which means that shares tend to trade on lower price to earnings multiples when inflation is high, and growth assets trade on higher income yields. We saw this in 2022 with bond yields surging, share markets falling and other growth assets pressured.

Source: Bloomberg, AMP
So, with inflation falling, much of this goes in reverse as we started to see in the last few months. In particular:
- Interest rates will start to come down. The Fed is expected to start cutting in May and the European Central Bank (ECB) to start cutting around April, both with 5 cuts this year. There is some chance that both could start cutting in March. The RBA is expected to start cutting around June, with 3 cuts this year.
- Shares can potentially trade on higher price-to-earnings (PEs) than otherwise.
- Lower interest rates with a lag are likely to provide some support for real assets like property.
Of course, the main risk is if economies slide into recession, which will mean another leg down in share markets before they start to benefit from lower interest rates. This is not our base case but it’s a high risk.
Concluding comment
Finally, while inflation is on the mend cyclically, it’s worth remembering that from a longer term perspective we have likely now entered a more inflation prone world than the one prior to the pandemic, reflecting bigger government; the reversal of globalisation; increasing defence spending; decarbonisation; less workers and more consumers as populations age. So short of a very deep recession, don’t expect interest rates to go back to anywhere near zero anytime soon.
Source: AMP
Seven key charts for investors to keep an eye on
By Robert Wright /December 01,2023/

Introduction
At the start of this year, we thought shares would have reasonable returns albeit it wouldn’t be smooth sailing given ongoing issues around inflation, interest rates, the risk of recession and geopolitics. So far so good. This note updates seven key charts we see as critical for the investment outlook.
Chart 1 – global business conditions PMIs
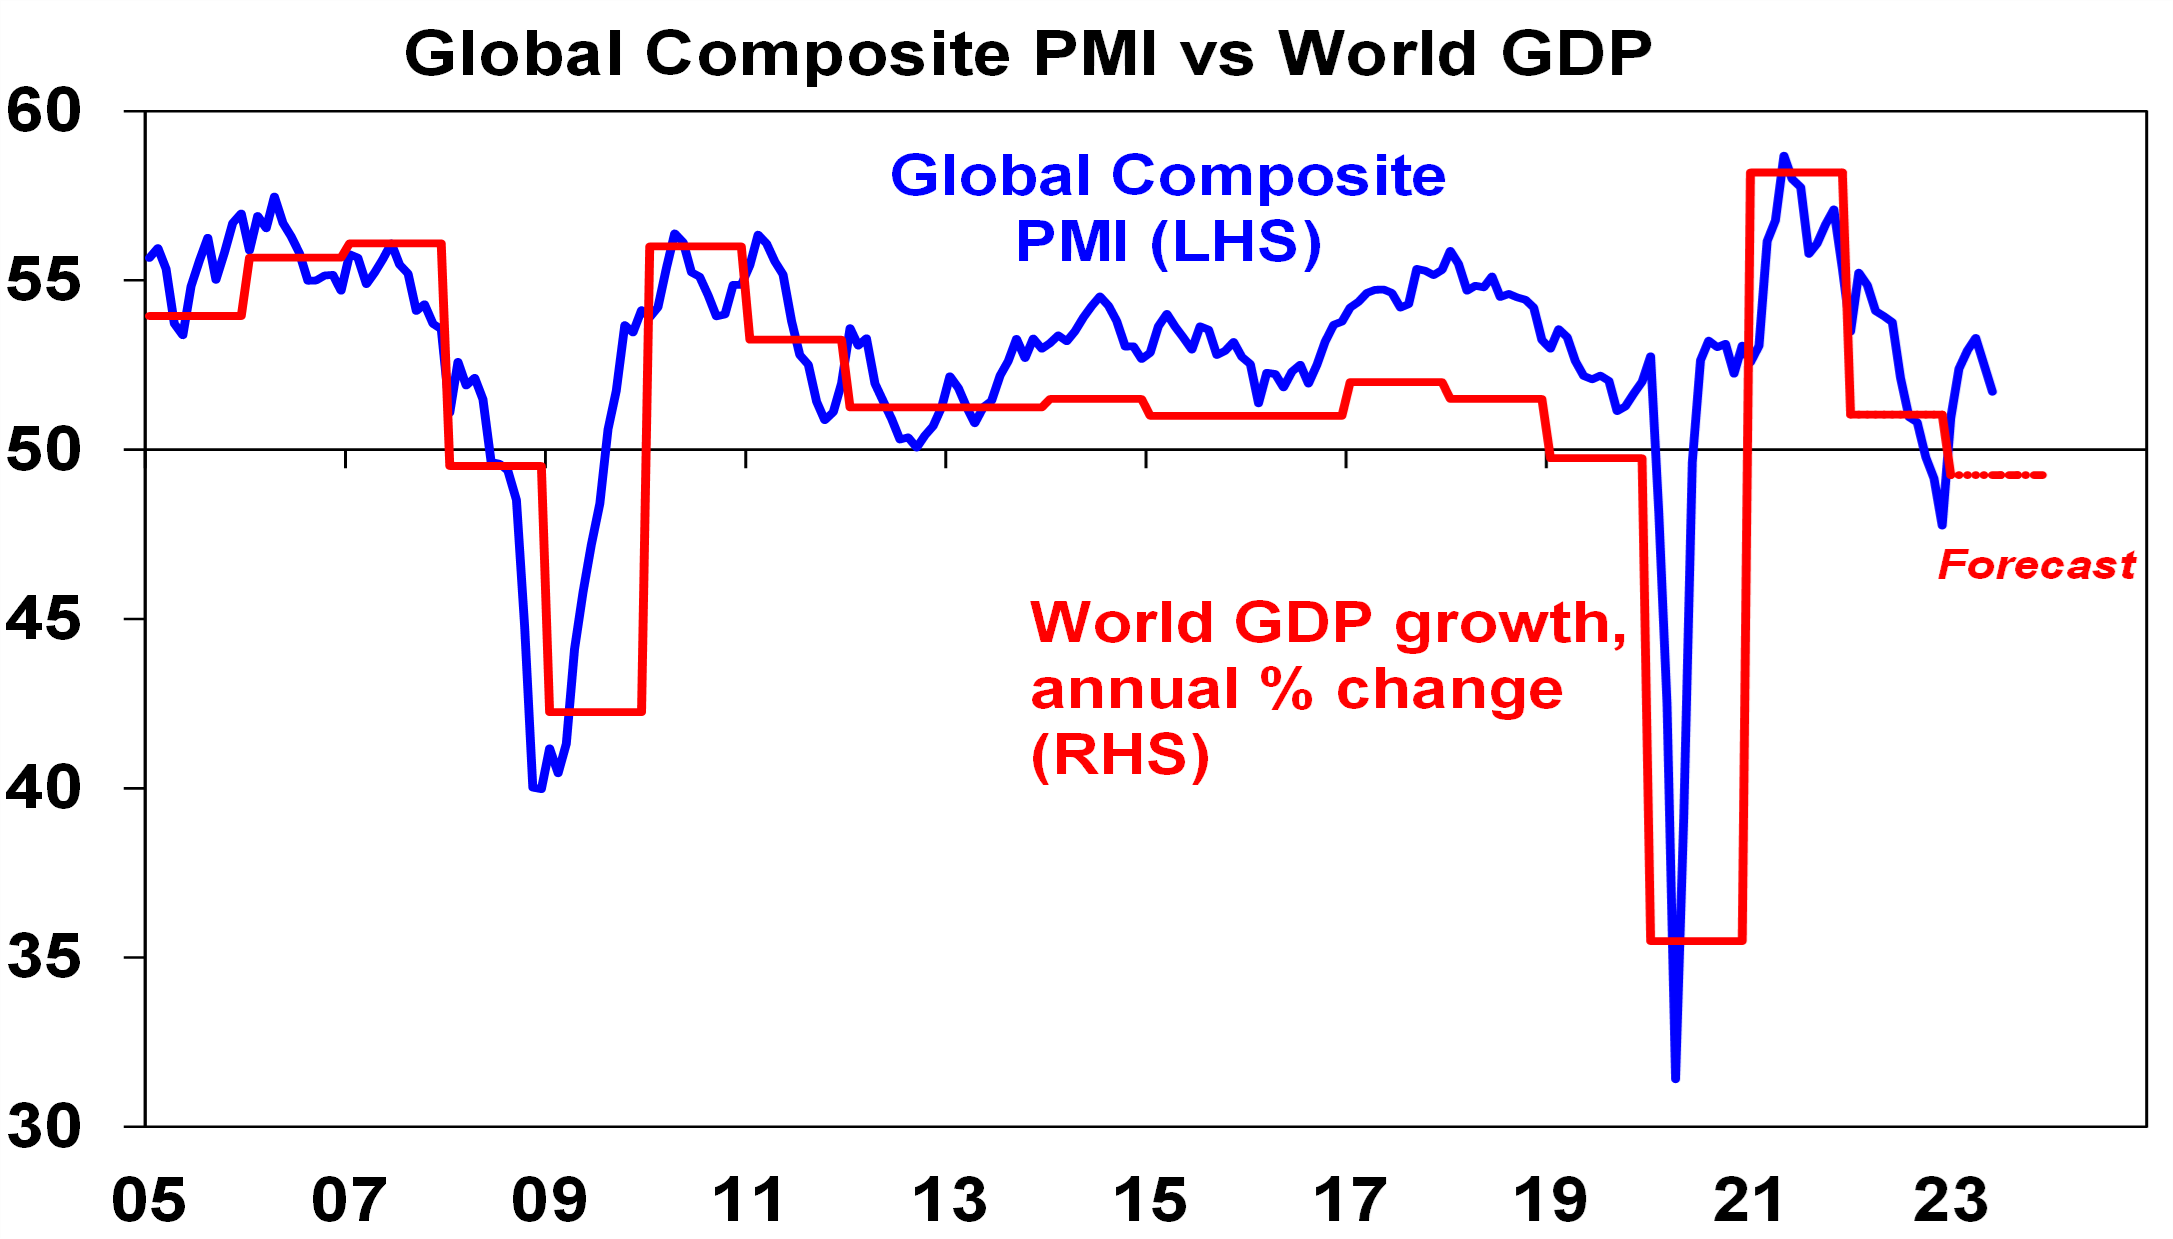
A big determinant of whether share markets can move higher or resume the bear market in US and global shares that started last year, will be whether major economies slide into recession and, if so, how deep that is. Our assessment is that the risk of a mild recession is high (particularly in Australia), but that at least a deep recession should be avoided. Global business conditions indexes (PMIs) – which are surveys of purchasing managers at businesses – will be a key warning indicator.
Source: Bloomberg, AMP
So far, they have proven resilient. While slowing again after a bounce – partly due to China – they are at levels consistent with okay global growth.
Chart 2 (and 2b) – inflation
Of course, a lot continues to ride on how far key central banks raise interest rates. And as has been the case for the last 18 months or so the path of inflation will play a key role in this. Over the last six months the news on this front has continued to improve with inflation rates in key countries rolling over. US inflation has now fallen from 9.1% YOY a year ago to 3% in June and our US Pipeline Inflation Indicator – reflecting a mix of supply and demand indicators – continues to point to a further decline. This reflects a combination of lower commodity prices, improved supply, lower transport costs and easing demand. Just as goods price inflation led on the way up, it’s now leading on the way down with services inflation rolling over as well.

Source: Bloomberg, AMP
Australian inflation is lagging the US by 6 months, but our Australian Pipeline Inflation Indicator suggests inflation here will continue to fall, even though we did see a rise in the September quarter of 1.2 per cent due to the uncertainty brought on by the Israel and Palestine conflict. The RBA has maintained its position in holding rates higher for longer to stop inflation. Our assessment is that the RBA is close to the top with rate cuts starting in February next year.
Source: Bloomberg, AMP
Chart 3 – unemployment and underemployment
Also critical is the tightness of labour markets as this will determine wages growth which has a big impact on services inflation. If wages growth accelerates too much in response to high inflation, it risks locking in high inflation with a wage-price spiral which would make it harder to get inflation down. Unemployment and underemployment are key indicators of whether this will occur or not. Both remain low in the US and Australia (putting upwards pressure on wages), but there is increasing evidence that labour markets are cooling. Wages growth is still rising in Australia (with the announcement effect of faster increases in minimum and award wages adding to this) but wages growth in the US looks to have peaked.
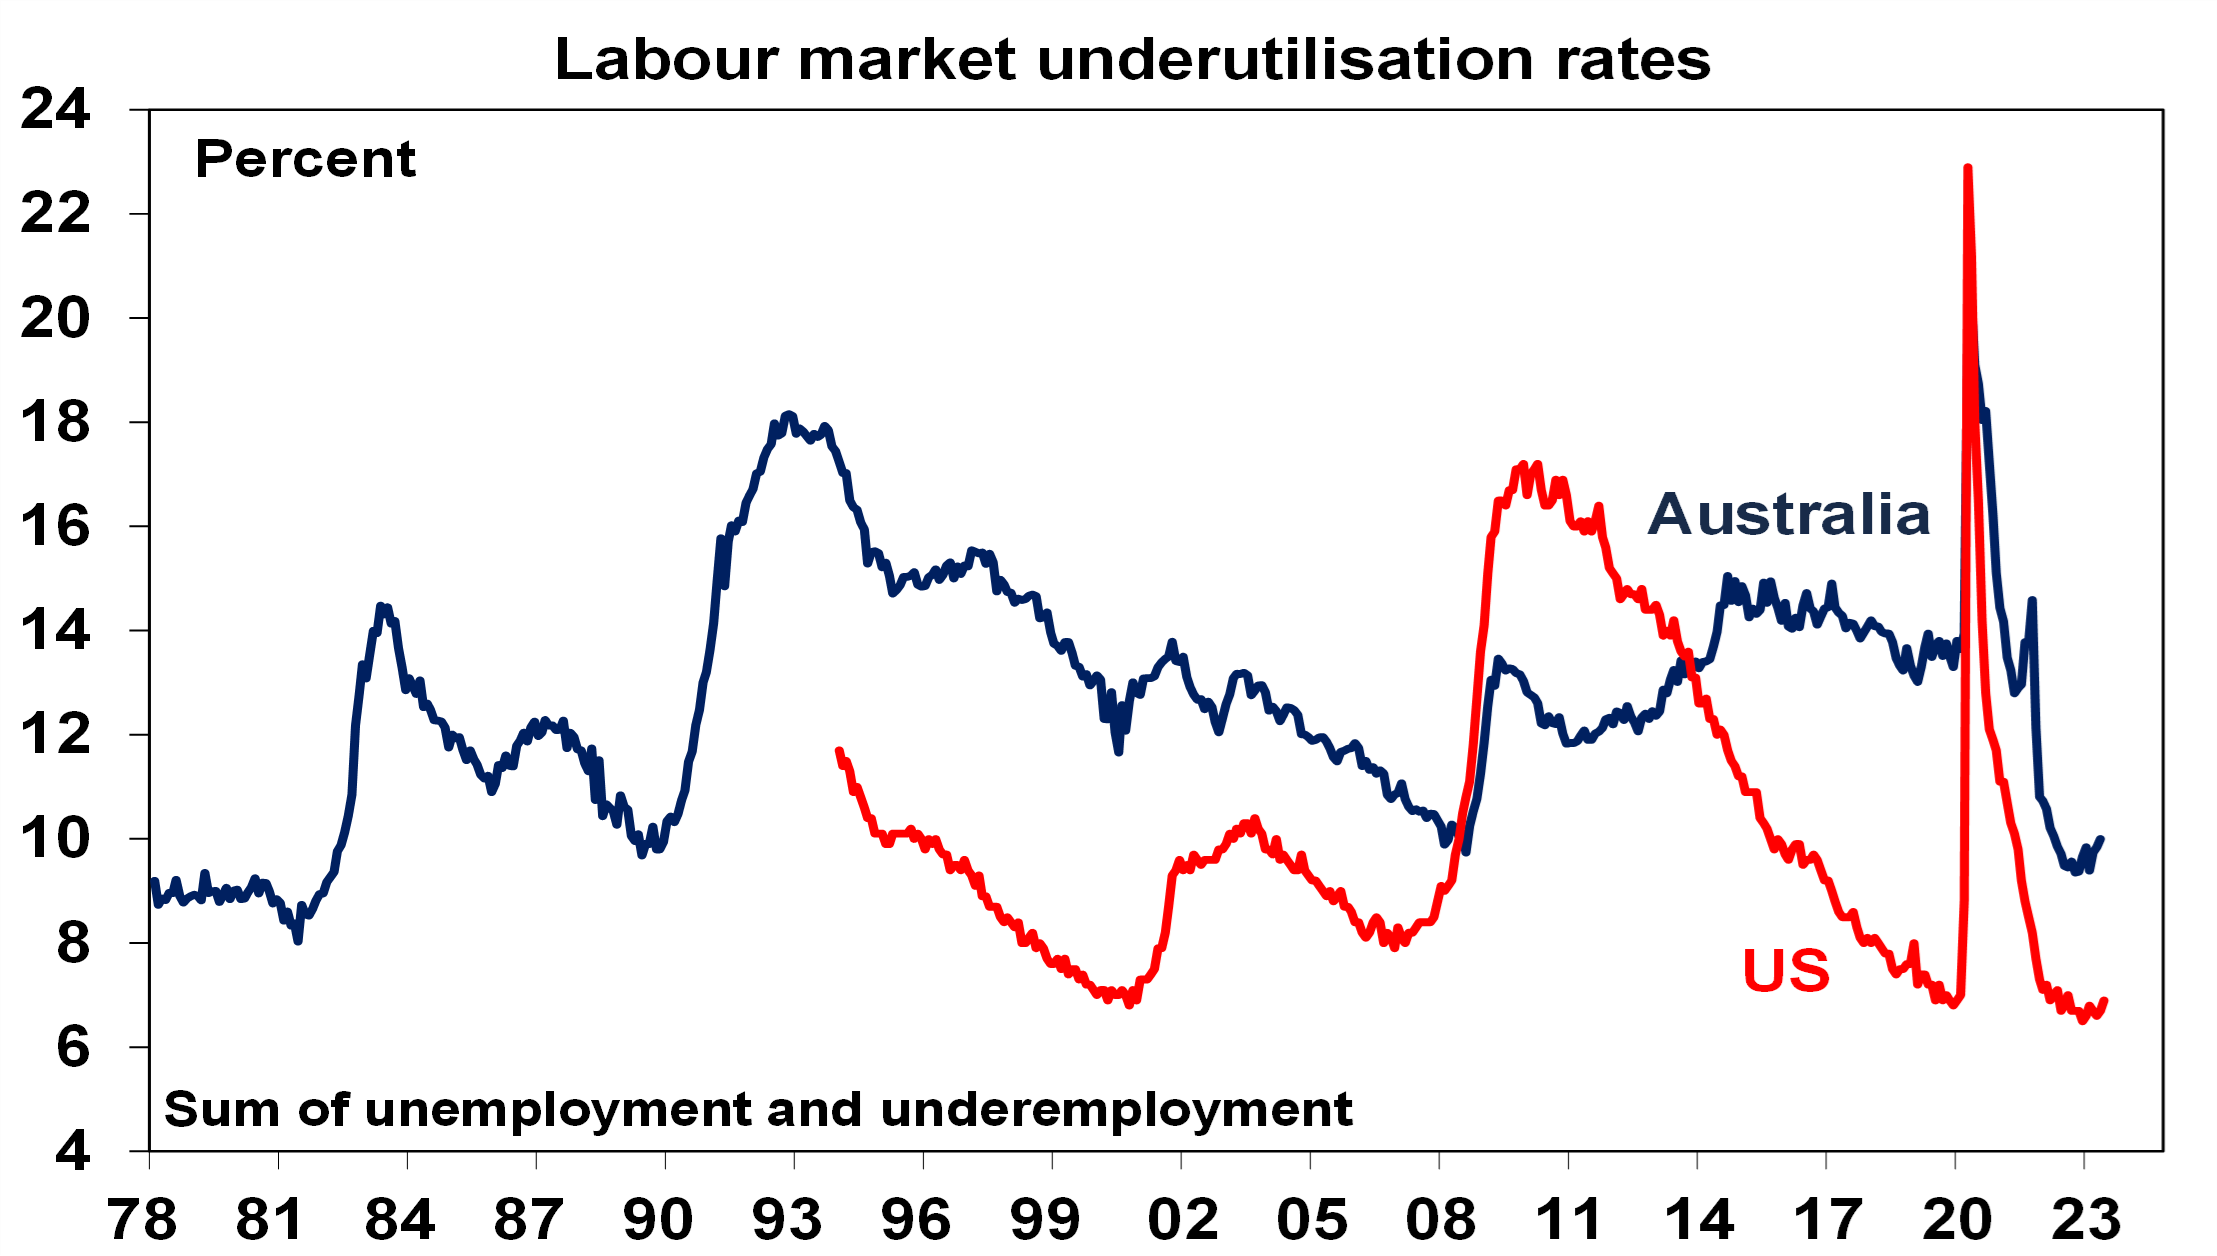
Source: Bloomberg, AMP
Chart 4 – longer term inflation expectations
The 1970s experience tells us the longer inflation stays high, the more businesses, workers and consumers expect it to stay high and then they behave in ways which perpetuate it – in terms of wage claims, price setting and tolerance for price rises. The good news is that short term (1-3 years ahead) inflation expectations have fallen sharply and longer term inflation expectations remain in the low range they have been in for the last three decades. This is very different from 1980 when inflation expectations were around 10% and deep recession was required to get inflation back down.
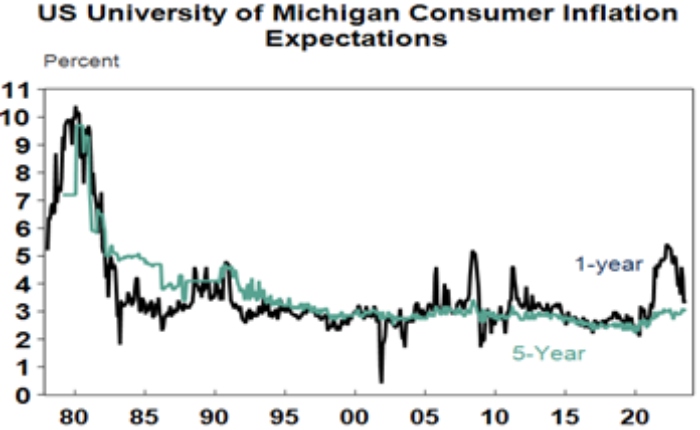
Source: Macrobond, AMP
Chart 5 – earnings revisions
Consensus US and global earnings growth expectations for this year have been downgraded to around zero with a 10% rise next year and for Australia the consensus expects a 3% fall this financial year.

Source: Reuters, AMP
A recession resulting in an earnings slump like those seen in the early 1990s, 2001-03 in the US and 2008 would be the biggest risk but recently revisions to earnings expectations have been moving up.
Chart 6 – the gap between earnings and bond yields
Since 2020, rising bond yields have weighed on share market valuations. As a result, the gap between earnings yields and bond yields (which is a proxy for shares’ risk premium) has narrowed to its lowest since the GFC in the US and Australia. Compared to the pre-GFC period shares still look cheap relative to bonds, but this is not the case compared to the post GFC period suggesting valuations may be a bit of a constraint to share market gains as current uncertainties suggests investors may demand a risk premium over bonds similar to that seen post GFC as opposed to what was seen pre GFC. Australian share valuations look a bit more attractive than those in the US though helped by a higher earnings yield (or lower PEs). Ideally bond yields need to decline and earnings downgrades need to be limited.

Source: Reuters, AMP
Chart 7 – the US dollar
Due to the relatively low exposure of the US economy to cyclical sectors (like manufacturing), the $US tends to be a “risk-off” currency. In other words, it goes up when there are worries about global growth and down when the outlook brightens. An increasing $US is also bad news for those with $US denominated debt in the emerging world. So, moves in it bear close watching as a key bellwether of the investment cycle. Last year the $US surged with safe haven demand in the face of worries about recession, war and aggressive Fed tightening. Since September though it has fallen back as inflation and Fed rate hike fears eased and geopolitical risks receded. And after stalling over the last six months, it’s since broken down again. A further downtrend in the $US would be a positive sign for investment markets this year, whereas a sustained new upswing would suggest they may be vulnerable. So far it’s going in the right direction.
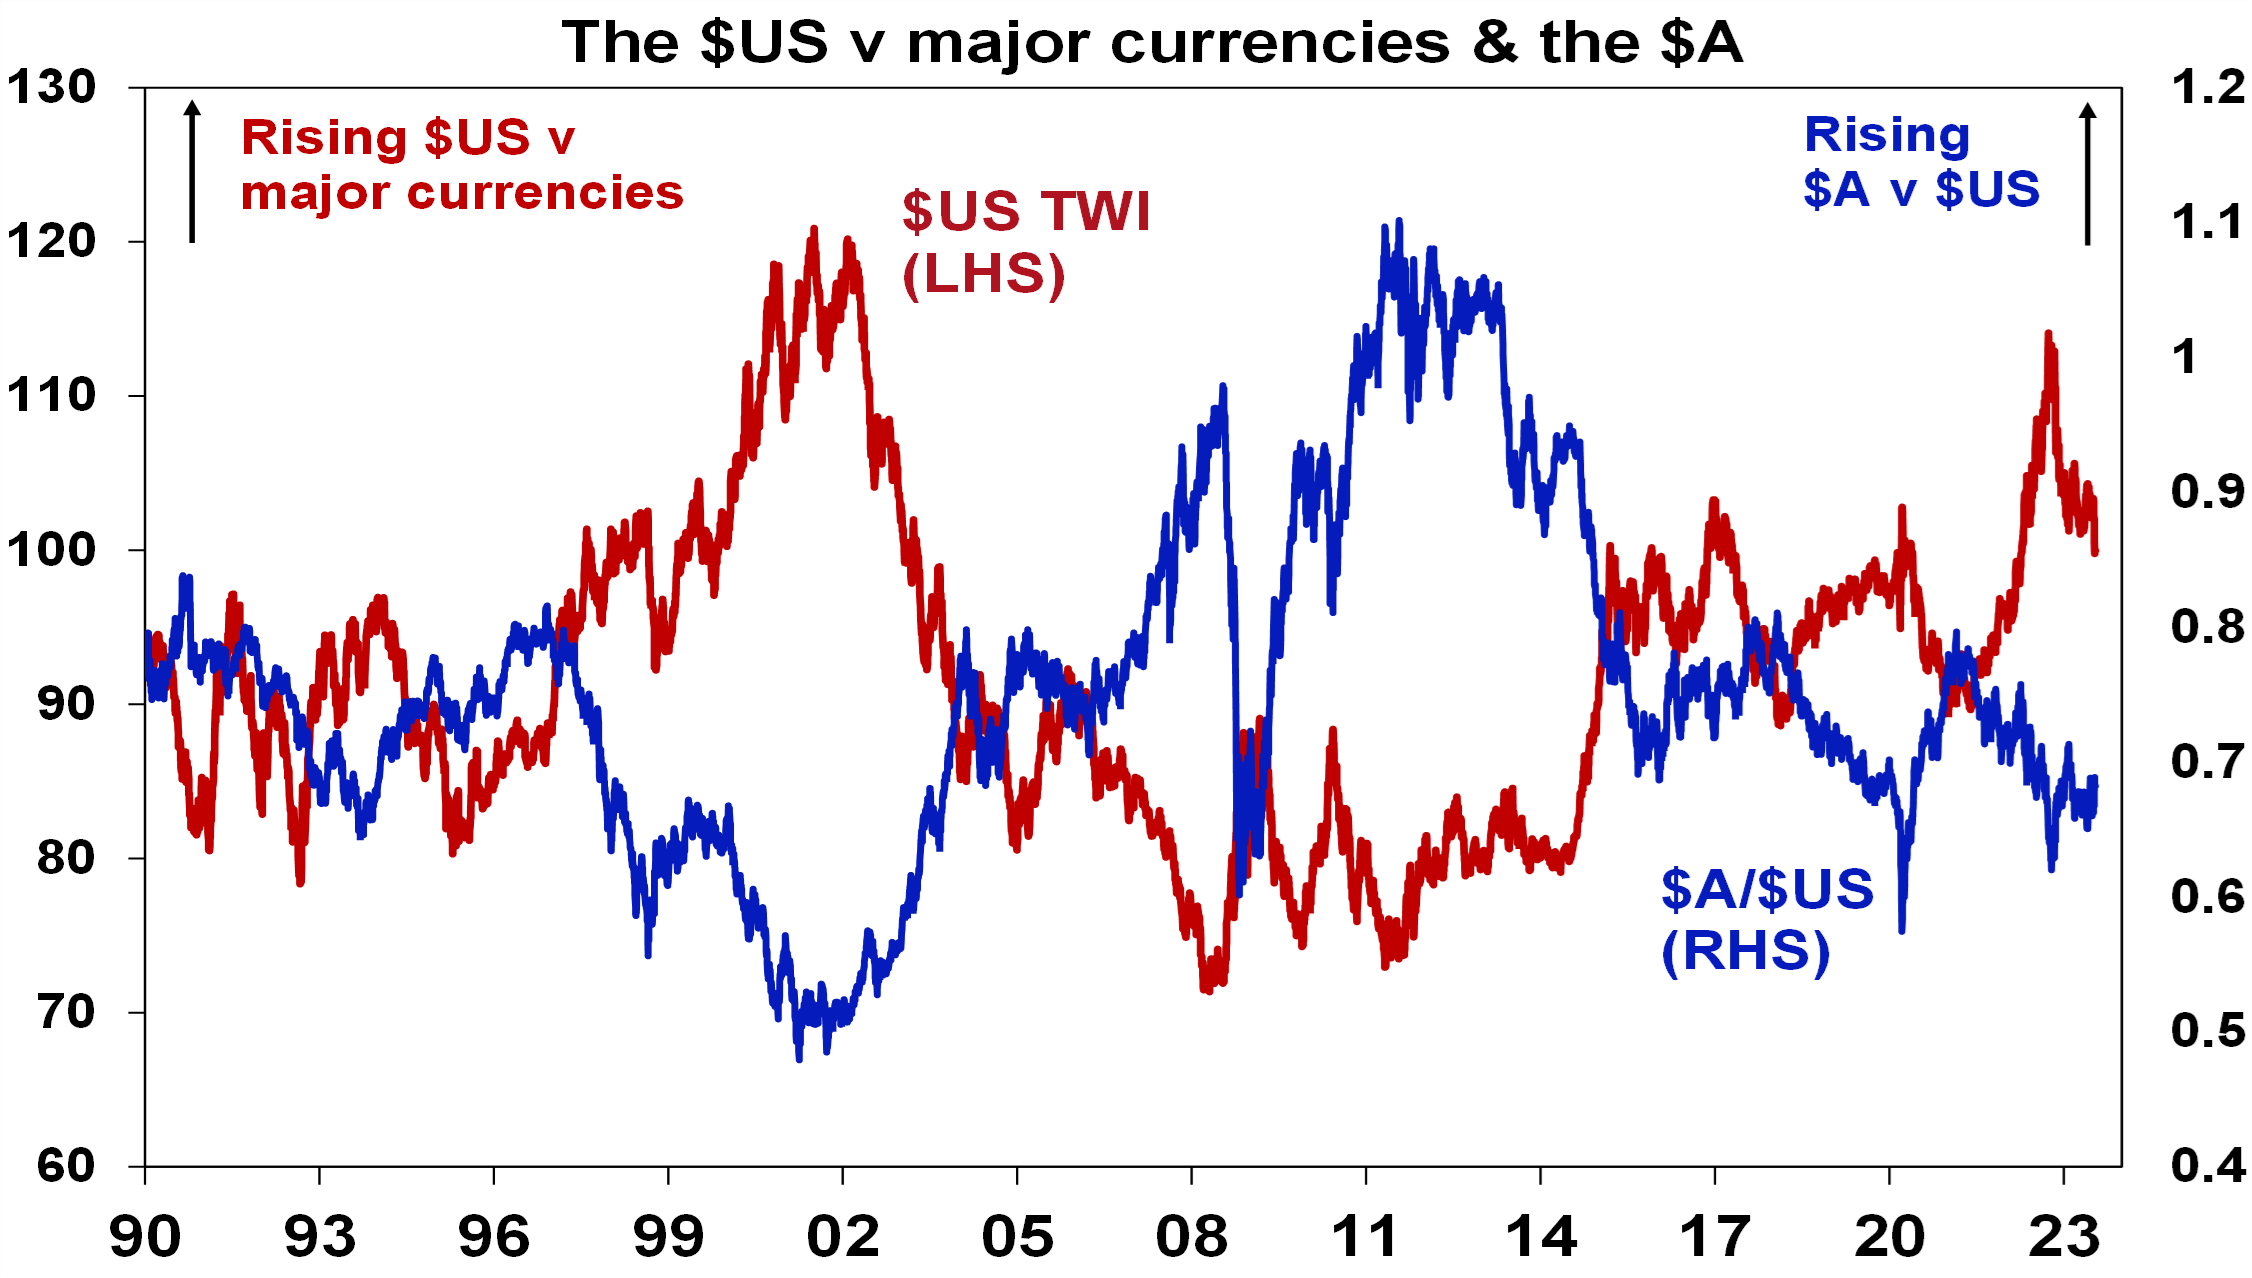
Source: Bloomberg, AMP
Source: AMP
Some recent questions on Australian inflation
By Robert Wright /August 21,2023/

Key points
- The Australian inflation rate peaked in the December quarter but has been slower to decline than some global peers. While interest rate rises are helping to reduce inflation (especially as discretionary consumer spending slows), rises in domestic energy prices, a tight rental market and a lagged pick up in wages have contributed to higher than expected inflation outcomes.
- The main policy available in the RBA’s toolkit to manage inflation is interest rates, which is a blunt tool because of its unequal impact on households with debt.
- The burden of interest rate increases falls on households with mortgage debt. Businesses and investors are also impacted but the deductibility of interest provides some offset.
- Some countries in Europe have opted to use price controls for essential items to reduce inflation, with mixed results. Price controls tend to add distortions to the market and rent controls are not helpful while housing supply is limited (like in Australia).
- But the government still has a role to play in helping the RBA achieve its 2-3% inflation target through keeping fiscal policy neutral/contractionary if inflation is high, ensuring a well functioning energy market, maintaining sustainable wage increases, regulating businesses to discourage price gouging and monopolistic behaviour and calibrating appropriate migration targets to match housing supply.
Introduction
Australian inflation is very high. Consumer prices were up by 7% over the year to March, around a 33-year high but this was a decline from a cyclical peak of 7.8% in December 2022. The Reserve Bank of Australia (RBA) has been focusing on reducing inflation through the main policy tool available in the central bank’s toolkit – interest rates. The cash rate has risen from 0.1% in April 2022 to 4.1% in June – a 4% lift in just over a year. But, the impact on inflation so far has been lower than expected. As a result, we are often asked whether interest rates are actually having an impact on inflation or whether there are better tools available to policymakers, especially as interest rate hikes are having an unequal impact across household groups. We go through some of these issues in this article.
Are interest rate hikes working to reduce inflation?
Interest rate hikes have led to a slowing in consumer demand which is helping to reduce inflation. Discretionary spending fell in the March quarter and the volumes of retail spending was negative over the December-March quarter. Without the lift in interest rates, inflation may have increased further and consumer and market-based medium-long term inflation expectations could have kept rising well above the RBA’s 2-3% inflation target.
Some might say that rate hikes should have worked faster or better by now to reduce inflation. The problem has been that there have been numerous supply driven elements of the inflation story that have been less sensitive to interest rate changes. COVID driven supply chain disruptions led to big increases in shipping costs, commodity prices like energy, metals and agriculture increased significantly in 2021-22 (mostly from supply disruptions), domestic energy supply issues led to an Australian energy crisis and multiple domestic floods led to higher food prices. While these issues may not be directly influenced by the level of change in interest rates, it is the responsibility of the RBA to ensure that supply driven price changes do not leak into consumer prices. A lot of these supply related issues are now resolved but it takes time for it to be reflected in the final inflation figures.
Evidence of excessive price gouging by businesses is not obvious. Profit margins have expanded (increasing from 10% in 2020 to a recent high of ~16%) but have generally moved in proportion to the rise in inflation (see the chart below) and are now declining. The profit share (ex mining) of GDP has also been fairly stable. And slowing consumer discretionary spending means that continued profit margin expansion will be unlikely.
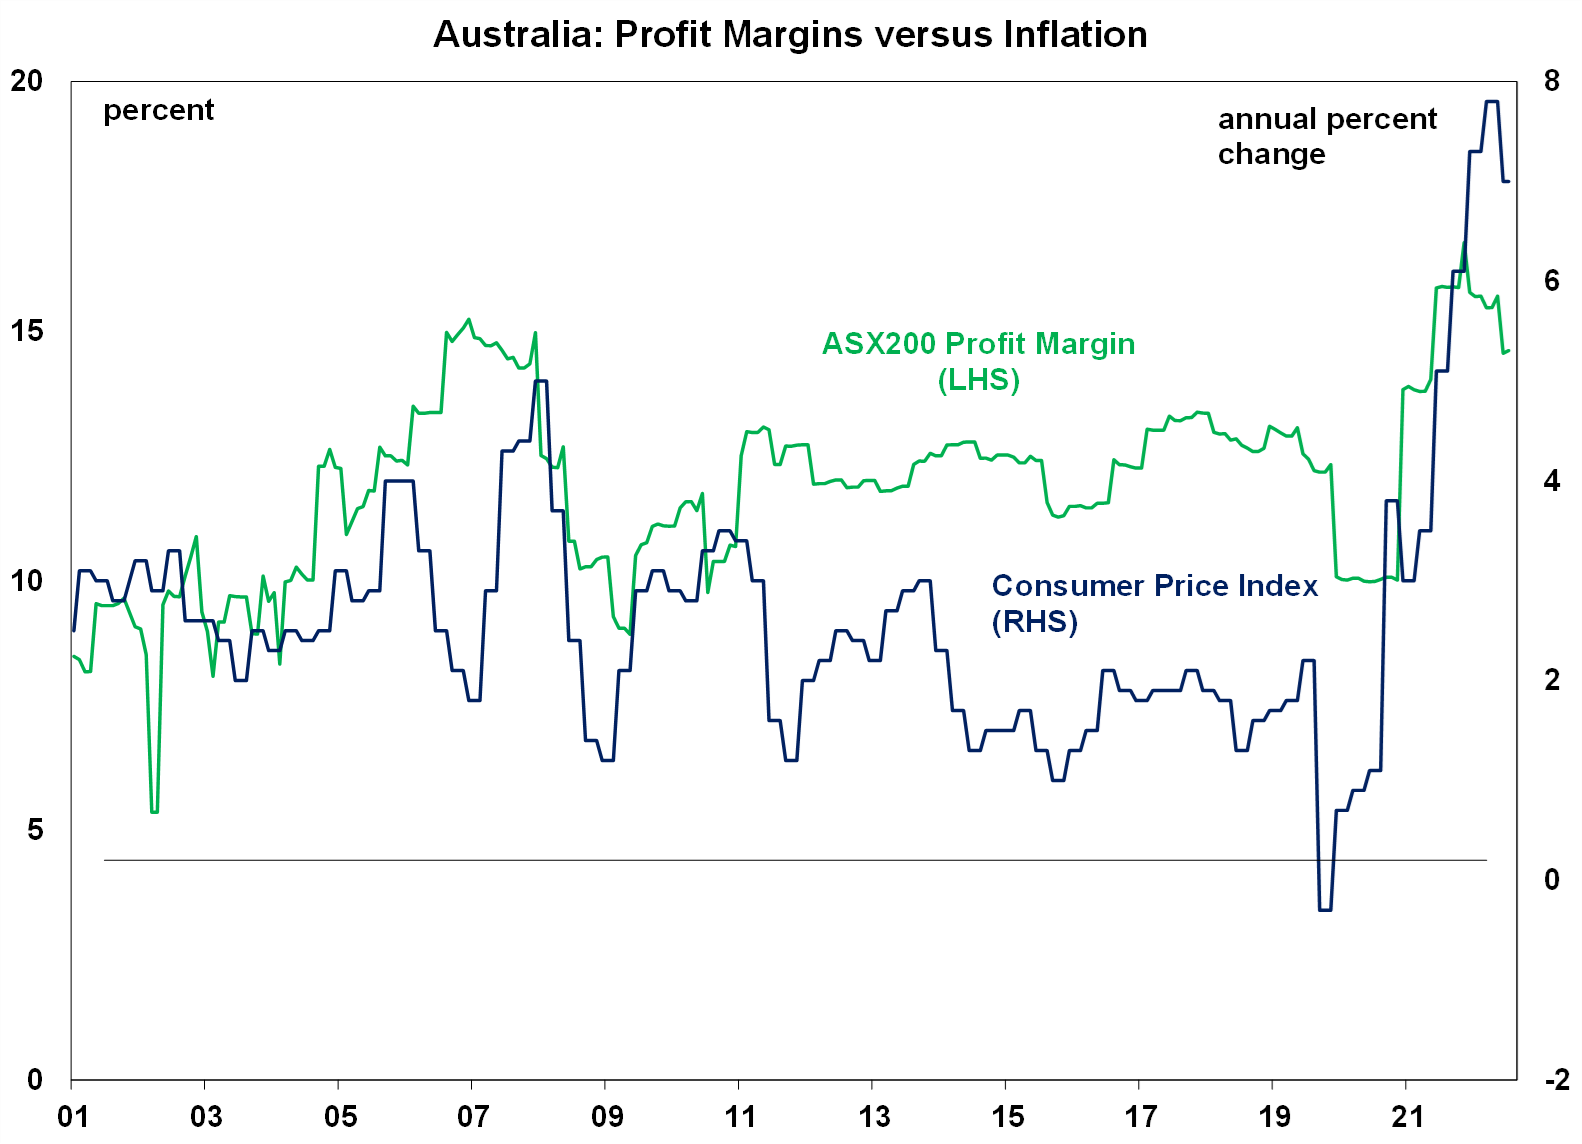
Source: Bloomberg, AMP
The peak of Australian inflation (in December 2022) also occurred later compared to some global peers which means that the slowing in inflation appears like it’s taking longer. US inflation peaked at 9.1% in June 2022 and in the Eurozone at 10.6% in October 2022 (see the next chart).

Source: Macrobond, AMP
Australia’s energy crisis occurred later relative to the Northern hemisphere, because of a raft of our own domestic issues like supply challenges with coal, a poor national plan for the energy transition and higher global prices. This meant that both the US and Europe were more impacted by an energy price surge in early 2022 from the war in Ukraine and the winter weather. Australia’s rental market also tightened significantly over the past year as net migration rebounded to record highs after the pandemic, pushing vacancy rates to ultra low levels in the capital cities and lifted rents, although recent vacancy rates across the capital cities have ticked up and newly advertised rental growth is slowing. Australia’s wage setting system also seems to have more “inertia”, with the minimum wage decision occurring once a year and many other wages like awards also based off this annual decision or driven by changes to headline inflation, which only peaked in December 2022.
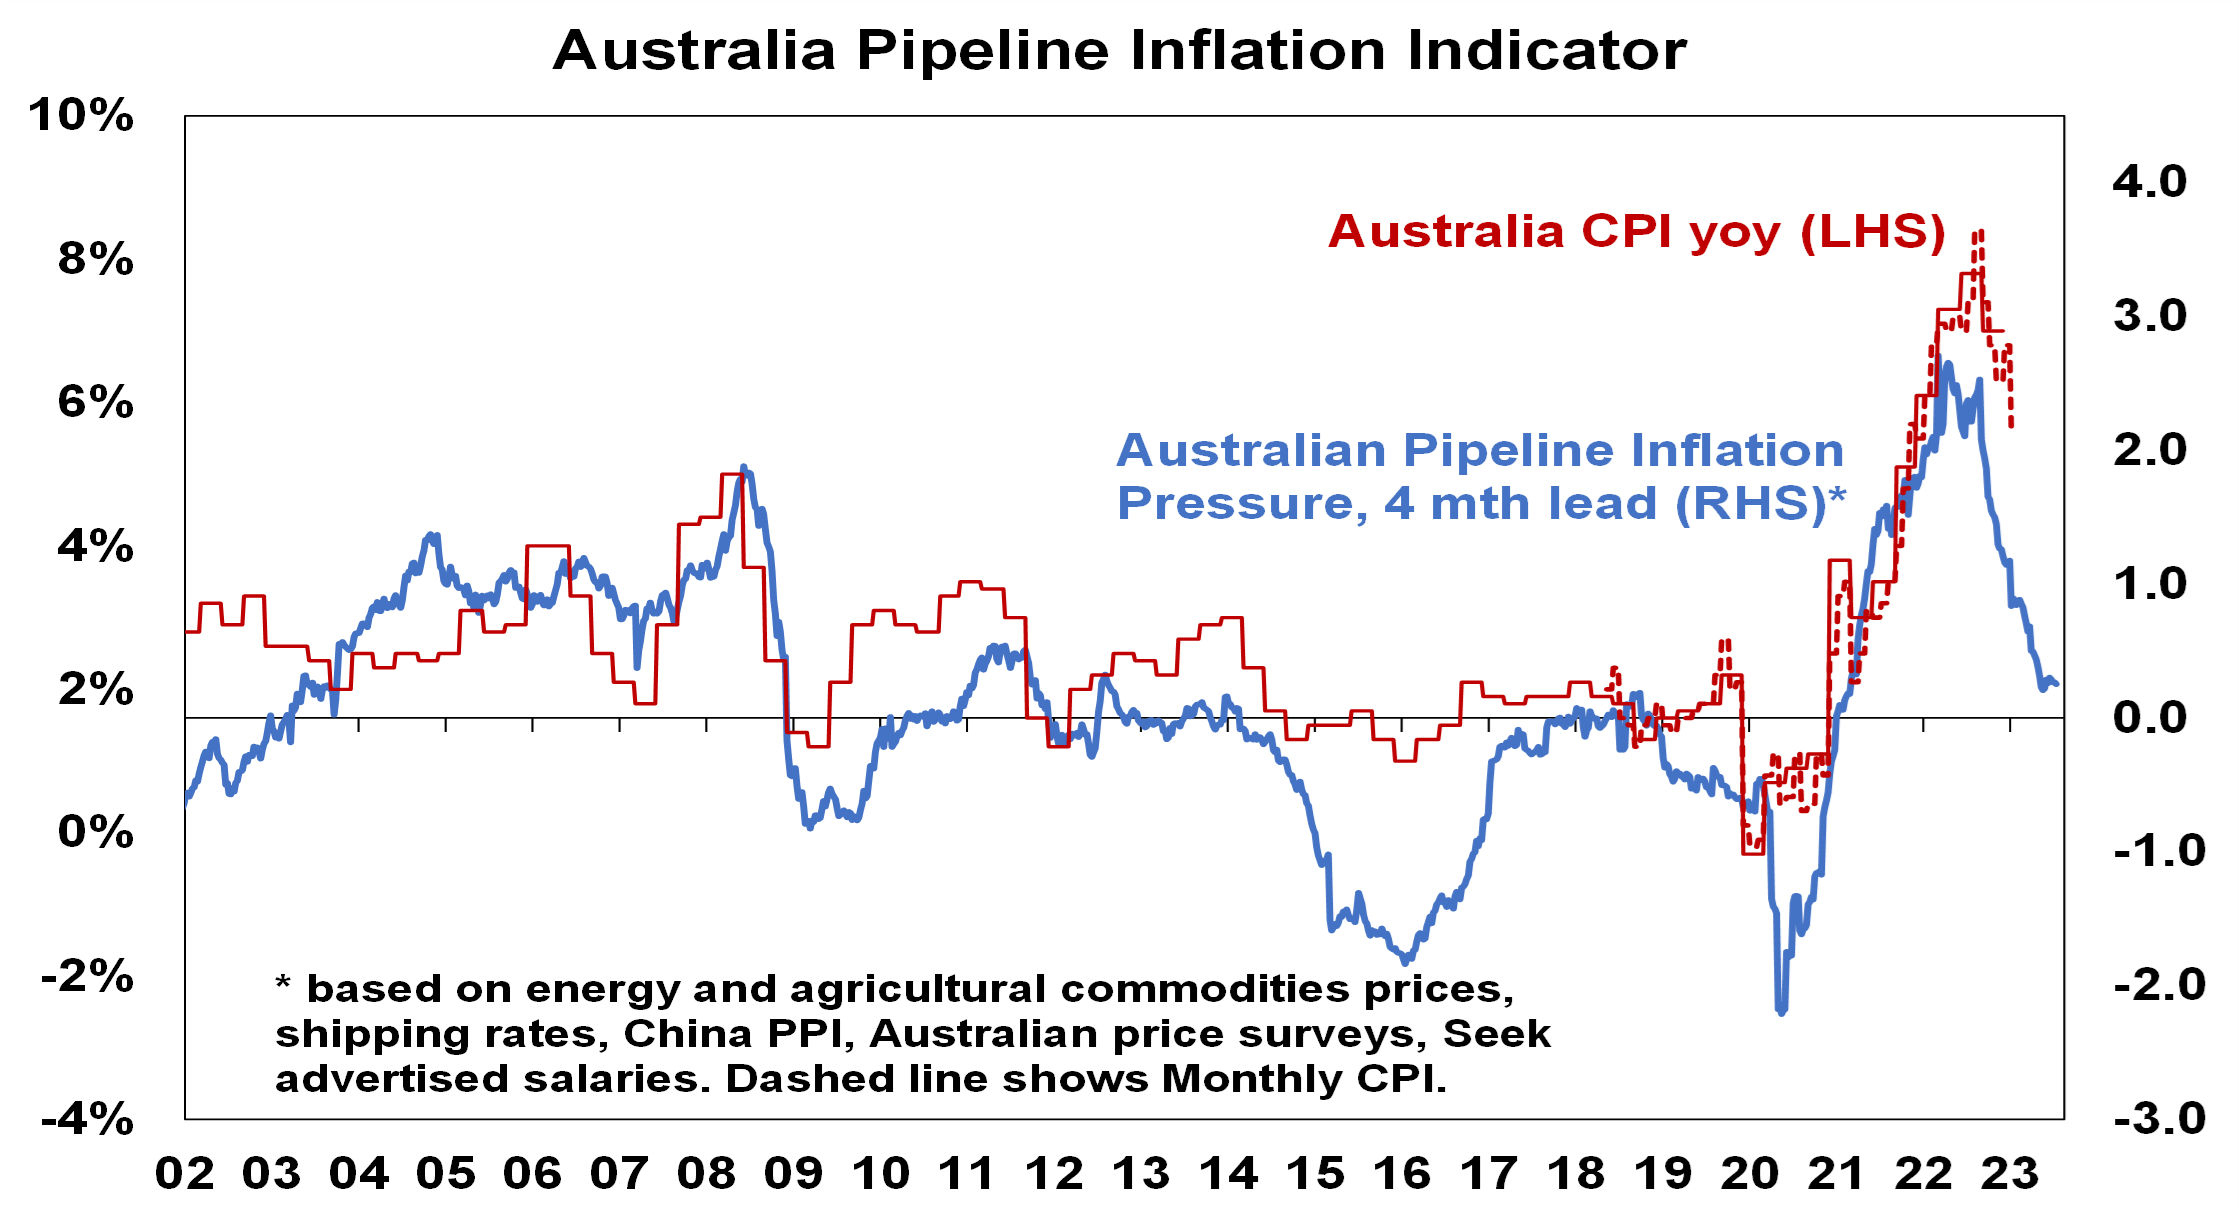
While these factors all suggest that inflation in Australia could remain higher for longer for now, the good news is that our Pipeline Inflation Indicator still suggests significant downside to Australian inflation over the next six months and we expect headline consumer prices to be at the top end of the RBA’s target band by early 2024 (on a 6-month annualised basis).

Source: Bloomberg, AMP
Are interest rate hikes increasing inequality?
The impact of monetary policy works primarily through the lending channel because borrowing rates are priced off the cash rate. Households with a mortgage are the most impacted by interest rate changes. Businesses and individual investors are arguably less impacted because they can deduct the debt interest expenses. There are also other financial market channels that monetary policy works through, mostly through the exchange rate.
The high level of household debt now means that mortgage holders will bear the brunt of monetary policy changes. Renters can also be affected from higher interest rates if landlords are able to pass on the higher cost of debt servicing through higher rents. This is only usually an option in a tight rental market (which the current situation is allowing for).
In Australia, 37% of households have a mortgage (using data from 2019-20), 29% rent and 30% own their own outright. Detailed ABS data on housing costs shows that households with a mortgage spend close to 16% of their gross household income on “housing costs” (mortgage or rent and rate payments) as at 2019-20, owners without a mortgage spend 3% of their income on housing costs and the average renter spends close to 20% of their income on housing. And there are divergences across income quintiles (see the chart below) with the lowest income quintiles spending a very large share of income on housing costs.

Source: Bloomberg, AMP
Are there other options to combat high inflation?
The high degree of supply related factors that have increased inflation, the slow reduction in prices despite aggressive interest rate hikes and the high burden placed on households with a mortgage has led to questions about whether there are other options available to reduce the level of inflation.
The RBA has been tasked with the responsibility for the 2-3% inflation target but the only tool at its disposal is monetary policy. While the range of options within the toolkit has expanded beyond interest rates (including yield targets and quantitative easing) all of these measures ultimately influence the money supply and therefore the cost of borrowing.
The government has more tools at its disposal compared to the RBA through its spending and taxation decisions as well as regulation. However, these tools are slow moving and do not have as much of a direct impact on inflation. Some have argued that price controls need to be considered in Australia. Food price caps have recently been tried in Europe for some essential items, including in France, Croatia and Hungary with mixed impacts as measured inflation went down but there were reports of some food shortages.
Usually, economists do not advocate for price controls or caps because it’s a distortion in the market and leads to problems like supply shortages. However, the Federal government did impose energy price caps domestically, so it is already being utilised in some capacity. Talk of rent controls would likely add to supply constraints across Australia at a time when housing supply needs to lift.
But, the government does have a role to play in many components that impact inflation, such as by ensuring a well regulated electricity market, sustainable outcomes for minimum award and public sector wages which set the tone for the rest of the market, ensuring that fiscal policy (both state and federal) is appropriate for the state of the economy (we think the impact of the May Federal budget is more or less neutral but with the addition of some state cost of living benefits it could be marginally inflationary and the government could consider raising taxes to help get inflation down), regulation of retailers to ensure adequate competition and ensuring adequate housing for the migration targets.
Implications for investors
For investors, the good news is that inflation is expected to decline through the rest of the year which should mean that central banks are close to the top of their tightening cycles. This is generally positive for sharemarkets however, the further interest rates increase, the higher the risk of recession which is a risk for sharemarkets. The RBA’s recent hawkish stance means that further increases to the cash rate are likely in Australia. We expect another two interest rate increases from here, taking the cash rate to 4.6% which risks a recession in the next 12 months because of the heightened sensitivity of households to interest rate hikes in Australia.
Source: AMP