
Tag Archives: Interest Rates
Seven key charts for investors to keep an eye on
By Robert Wright /December 01,2023/

Introduction
At the start of this year, we thought shares would have reasonable returns albeit it wouldn’t be smooth sailing given ongoing issues around inflation, interest rates, the risk of recession and geopolitics. So far so good. This note updates seven key charts we see as critical for the investment outlook.
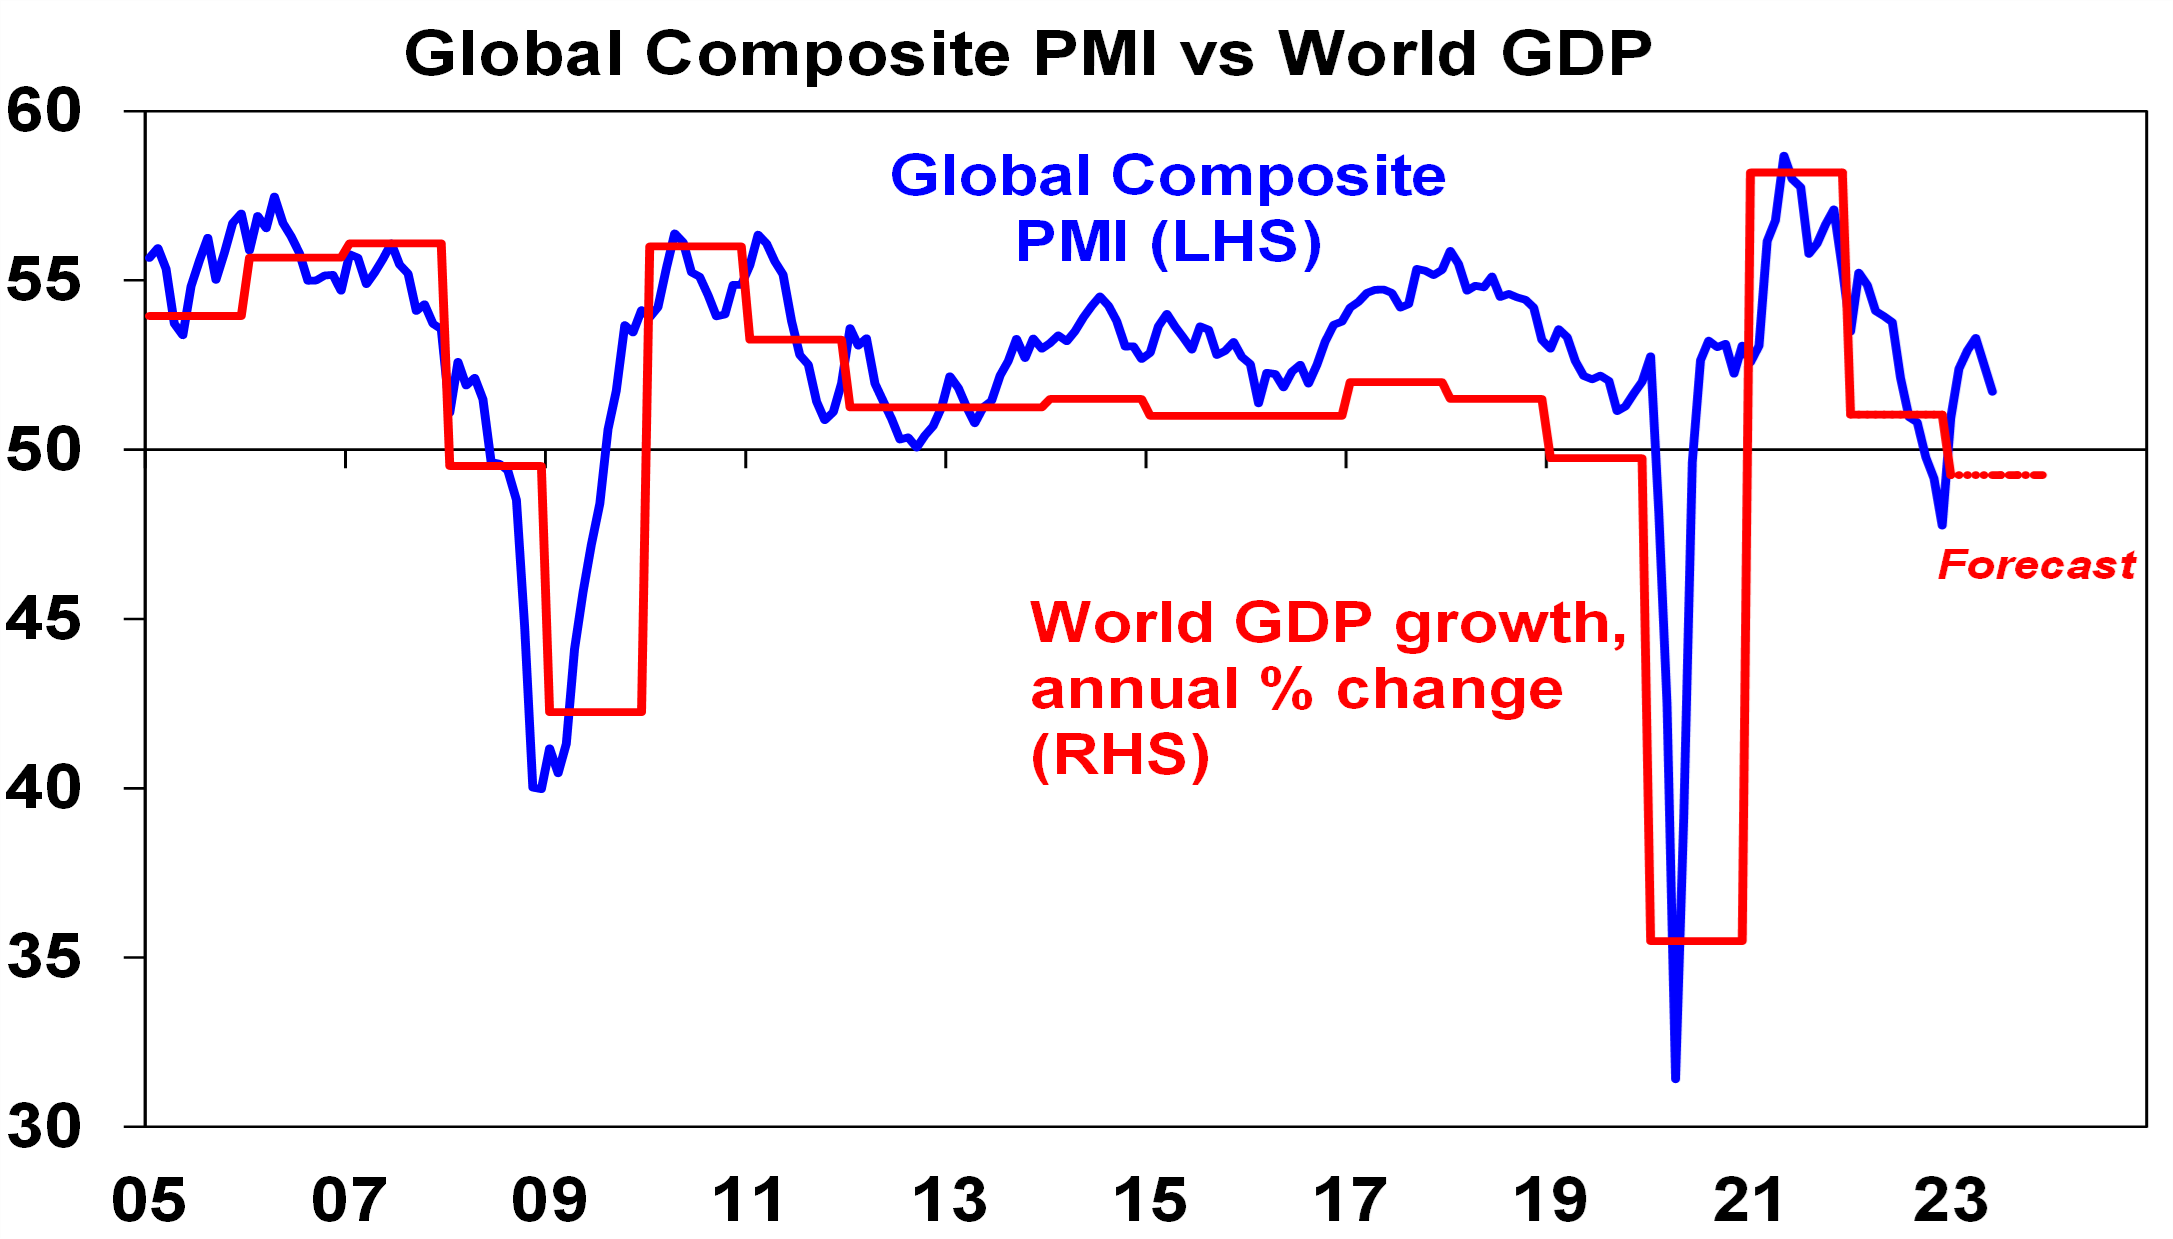
Chart 1 – global business conditions PMIs
A big determinant of whether share markets can move higher or resume the bear market in US and global shares that started last year, will be whether major economies slide into recession and, if so, how deep that is. Our assessment is that the risk of a mild recession is high (particularly in Australia), but that at least a deep recession should be avoided. Global business conditions indexes (PMIs) – which are surveys of purchasing managers at businesses – will be a key warning indicator.
Source: Bloomberg, AMP
So far, they have proven resilient. While slowing again after a bounce – partly due to China – they are at levels consistent with okay global growth.
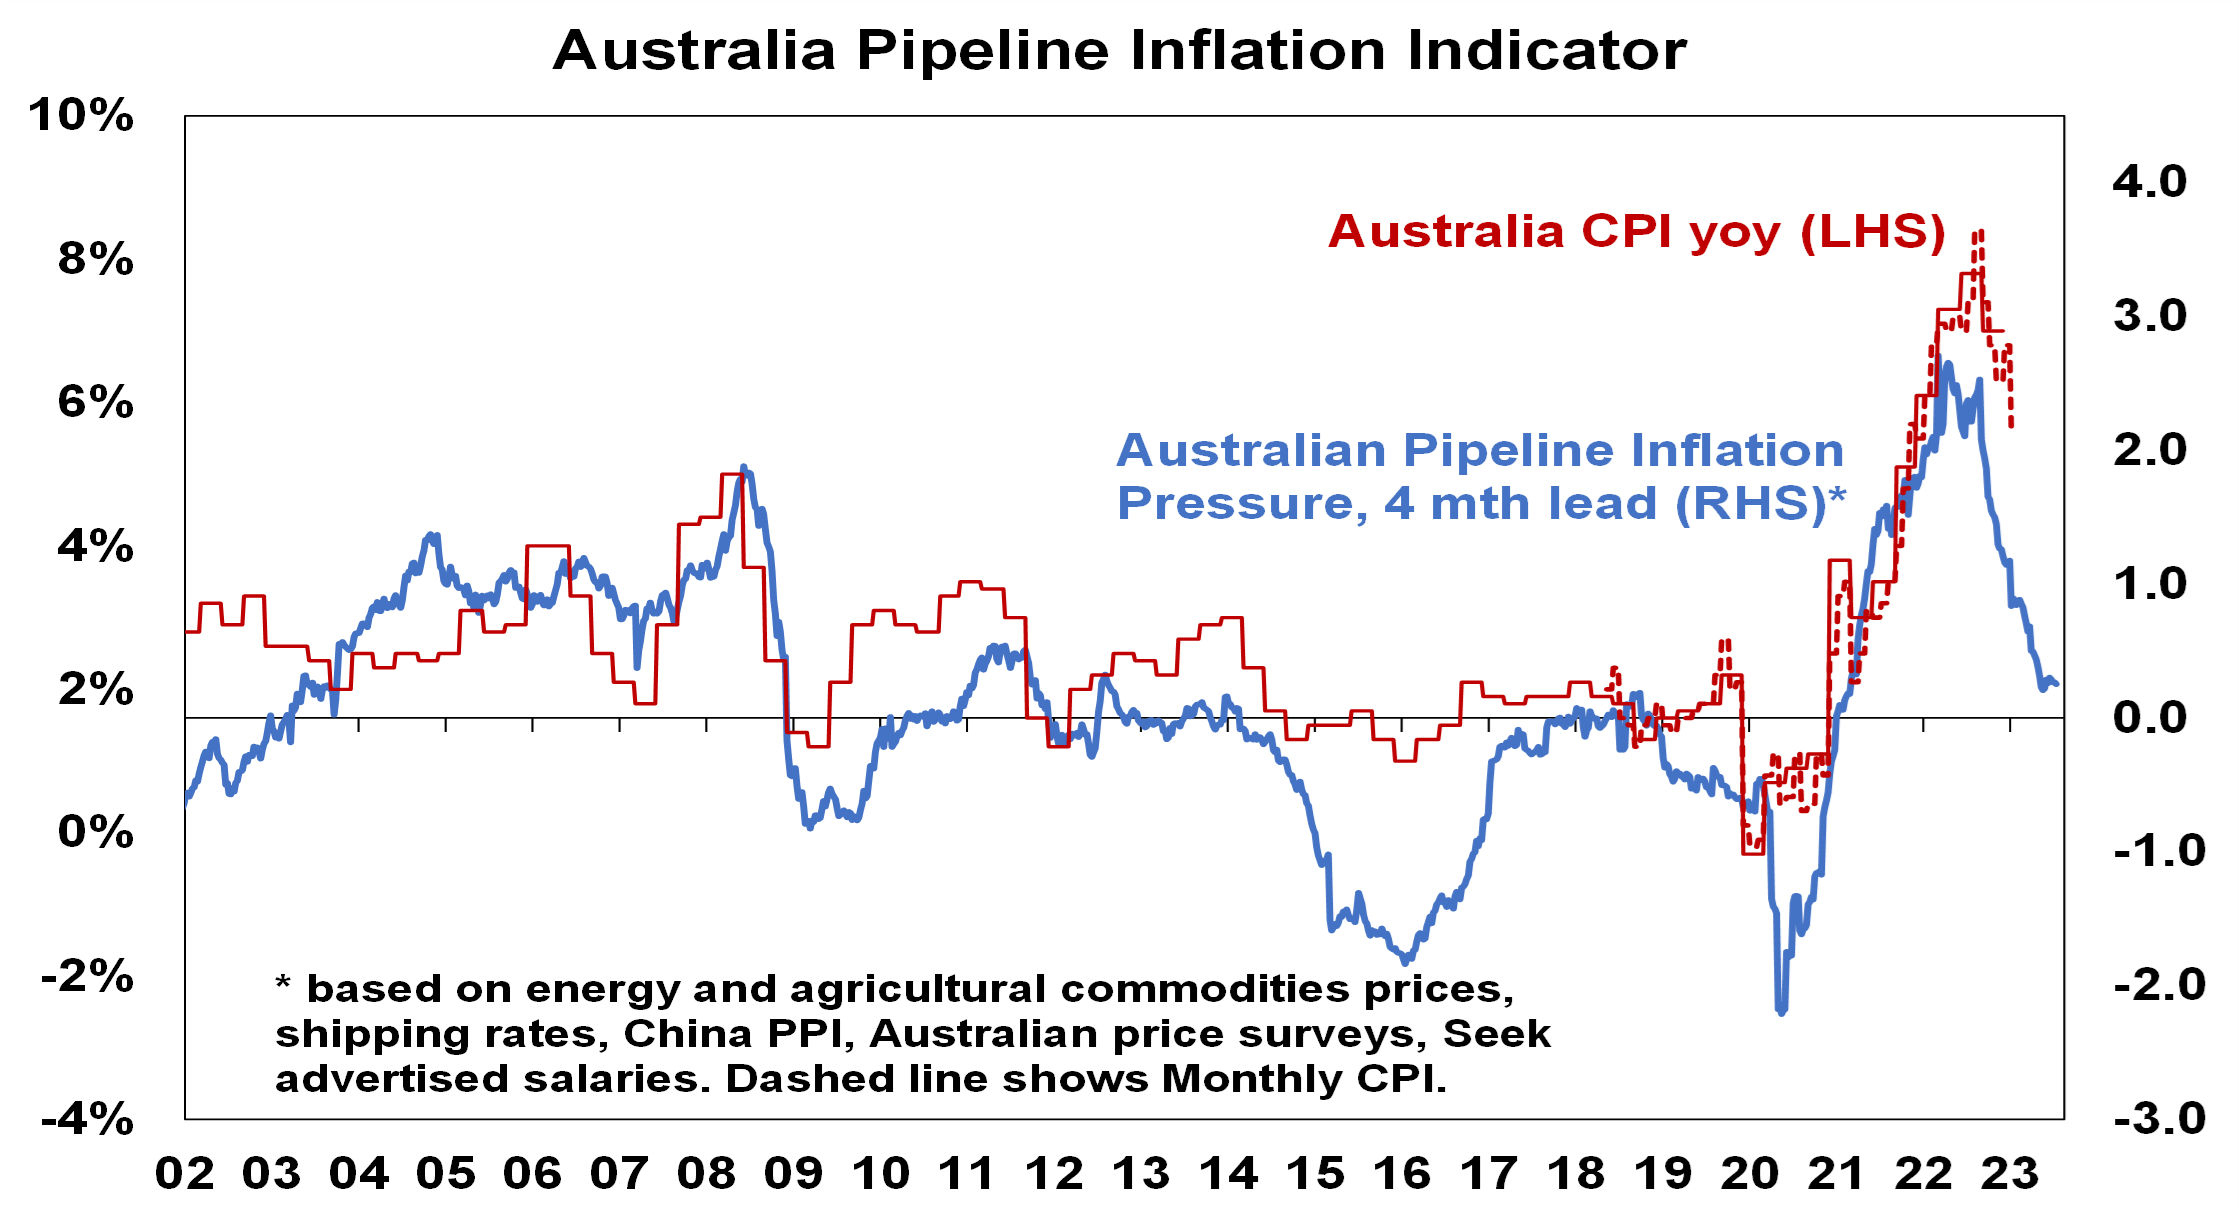
Chart 2 (and 2b) – inflation
Of course, a lot continues to ride on how far key central banks raise interest rates. And as has been the case for the last 18 months or so the path of inflation will play a key role in this. Over the last six months the news on this front has continued to improve with inflation rates in key countries rolling over. US inflation has now fallen from 9.1% YOY a year ago to 3% in June and our US Pipeline Inflation Indicator – reflecting a mix of supply and demand indicators – continues to point to a further decline. This reflects a combination of lower commodity prices, improved supply, lower transport costs and easing demand. Just as goods price inflation led on the way up, it’s now leading on the way down with services inflation rolling over as well.

Source: Bloomberg, AMP
Australian inflation is lagging the US by 6 months, but our Australian Pipeline Inflation Indicator suggests inflation here will continue to fall, even though we did see a rise in the September quarter of 1.2 per cent due to the uncertainty brought on by the Israel and Palestine conflict. The RBA has maintained its position in holding rates higher for longer to stop inflation. Our assessment is that the RBA is close to the top with rate cuts starting in February next year.
Source: Bloomberg, AMP
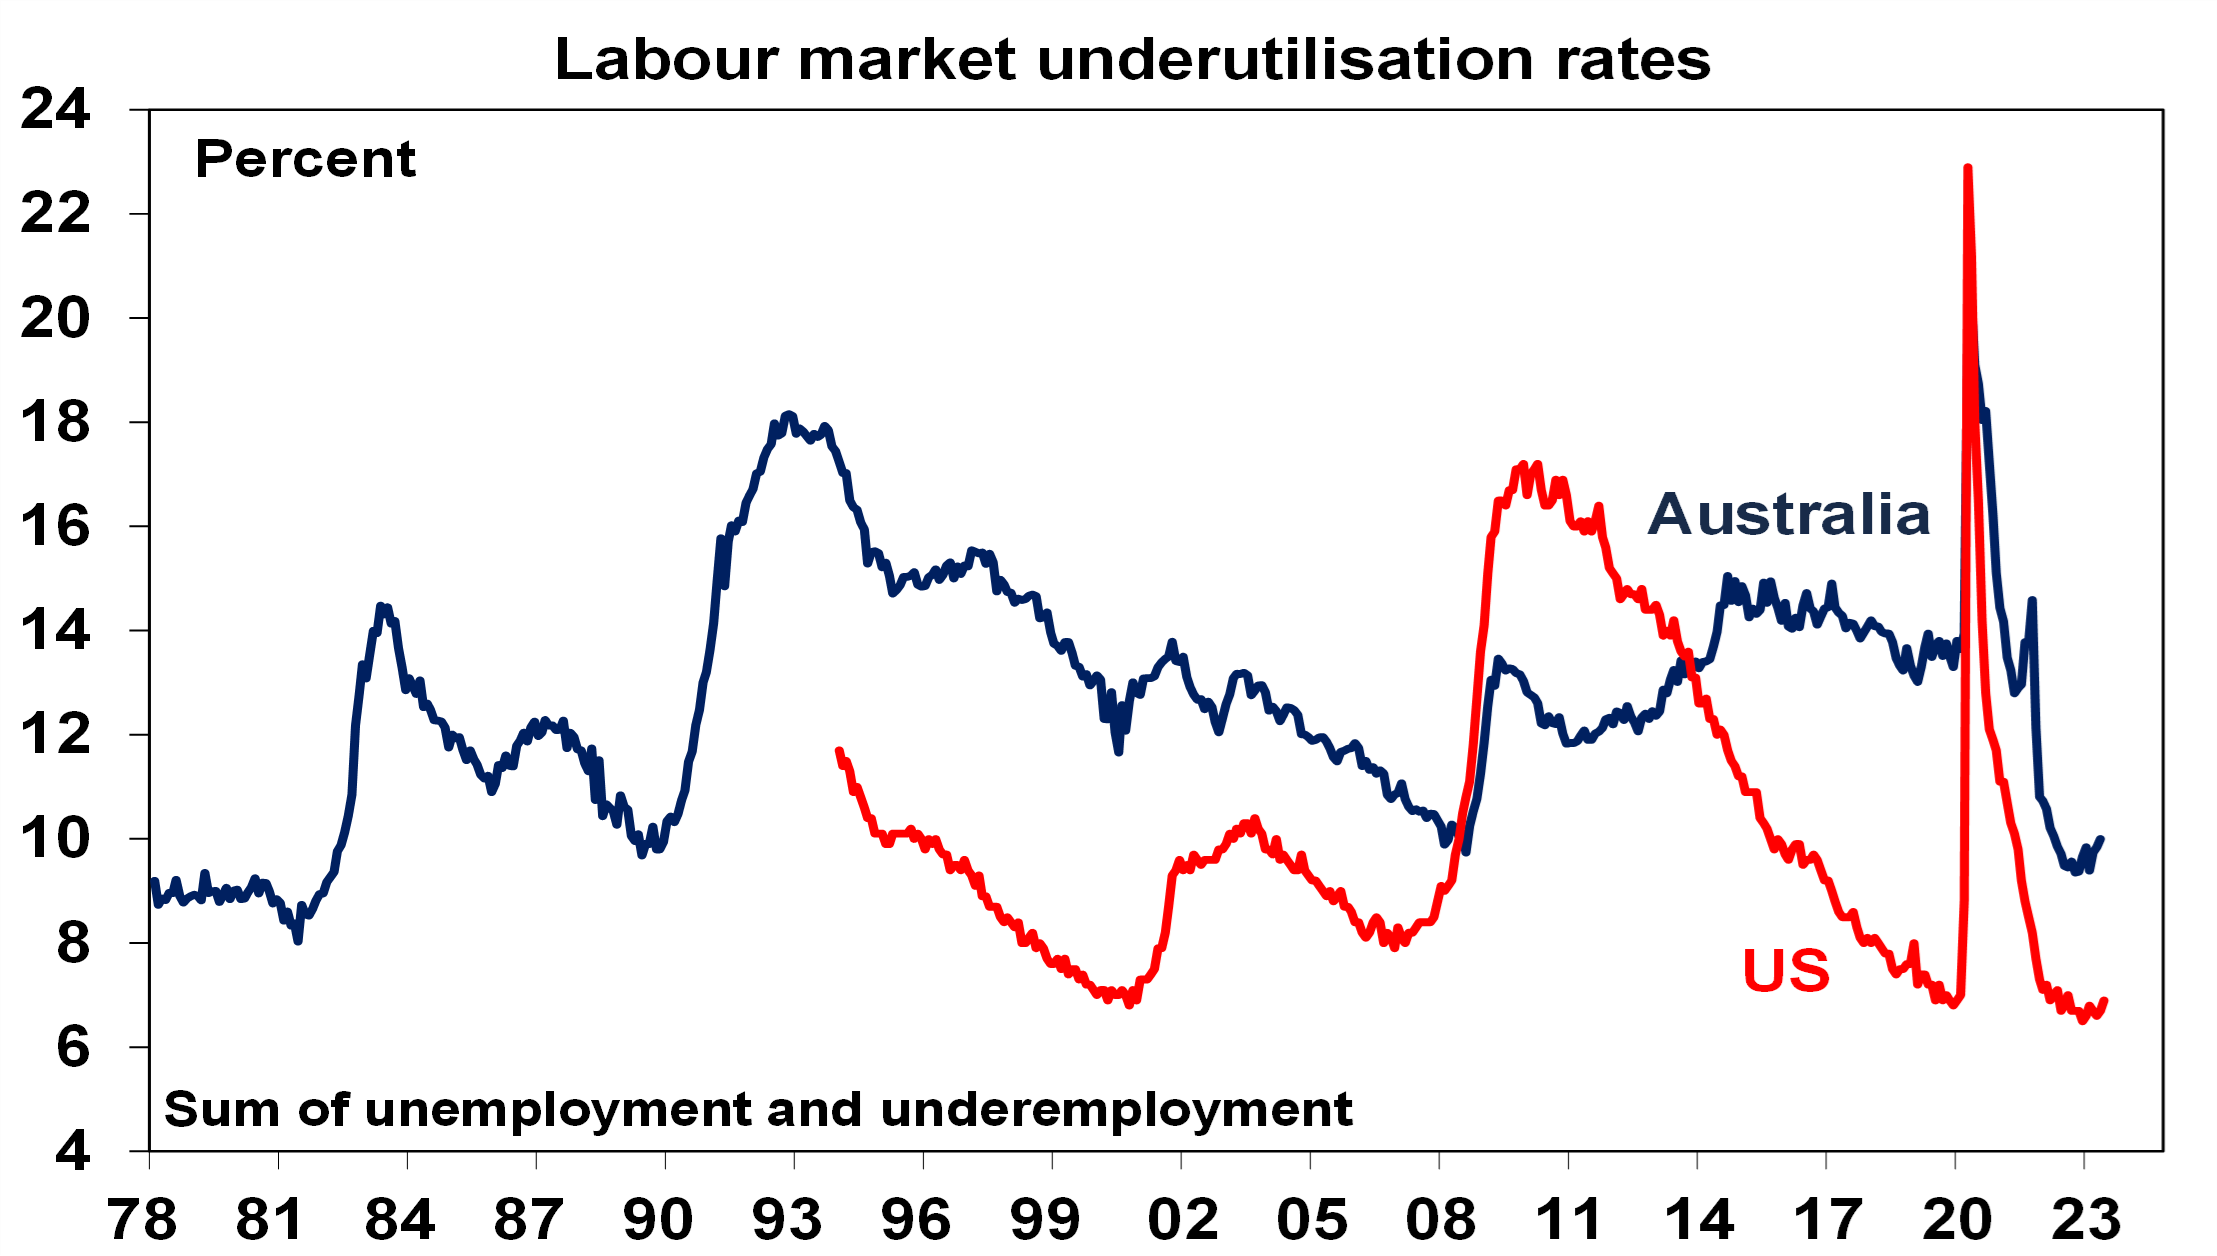
Chart 3 – unemployment and underemployment
Also critical is the tightness of labour markets as this will determine wages growth which has a big impact on services inflation. If wages growth accelerates too much in response to high inflation, it risks locking in high inflation with a wage-price spiral which would make it harder to get inflation down. Unemployment and underemployment are key indicators of whether this will occur or not. Both remain low in the US and Australia (putting upwards pressure on wages), but there is increasing evidence that labour markets are cooling. Wages growth is still rising in Australia (with the announcement effect of faster increases in minimum and award wages adding to this) but wages growth in the US looks to have peaked.
Source: Bloomberg, AMP
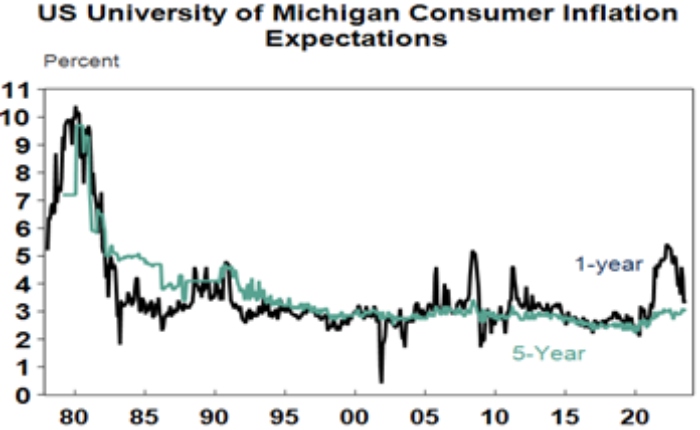
Chart 4 – longer term inflation expectations
The 1970s experience tells us the longer inflation stays high, the more businesses, workers and consumers expect it to stay high and then they behave in ways which perpetuate it – in terms of wage claims, price setting and tolerance for price rises. The good news is that short term (1-3 years ahead) inflation expectations have fallen sharply and longer term inflation expectations remain in the low range they have been in for the last three decades. This is very different from 1980 when inflation expectations were around 10% and deep recession was required to get inflation back down.
Source: Macrobond, AMP
Chart 5 – earnings revisions
Consensus US and global earnings growth expectations for this year have been downgraded to around zero with a 10% rise next year and for Australia the consensus expects a 3% fall this financial year.

Source: Reuters, AMP
A recession resulting in an earnings slump like those seen in the early 1990s, 2001-03 in the US and 2008 would be the biggest risk but recently revisions to earnings expectations have been moving up.
Chart 6 – the gap between earnings and bond yields
Since 2020, rising bond yields have weighed on share market valuations. As a result, the gap between earnings yields and bond yields (which is a proxy for shares’ risk premium) has narrowed to its lowest since the GFC in the US and Australia. Compared to the pre-GFC period shares still look cheap relative to bonds, but this is not the case compared to the post GFC period suggesting valuations may be a bit of a constraint to share market gains as current uncertainties suggests investors may demand a risk premium over bonds similar to that seen post GFC as opposed to what was seen pre GFC. Australian share valuations look a bit more attractive than those in the US though helped by a higher earnings yield (or lower PEs). Ideally bond yields need to decline and earnings downgrades need to be limited.

Source: Reuters, AMP
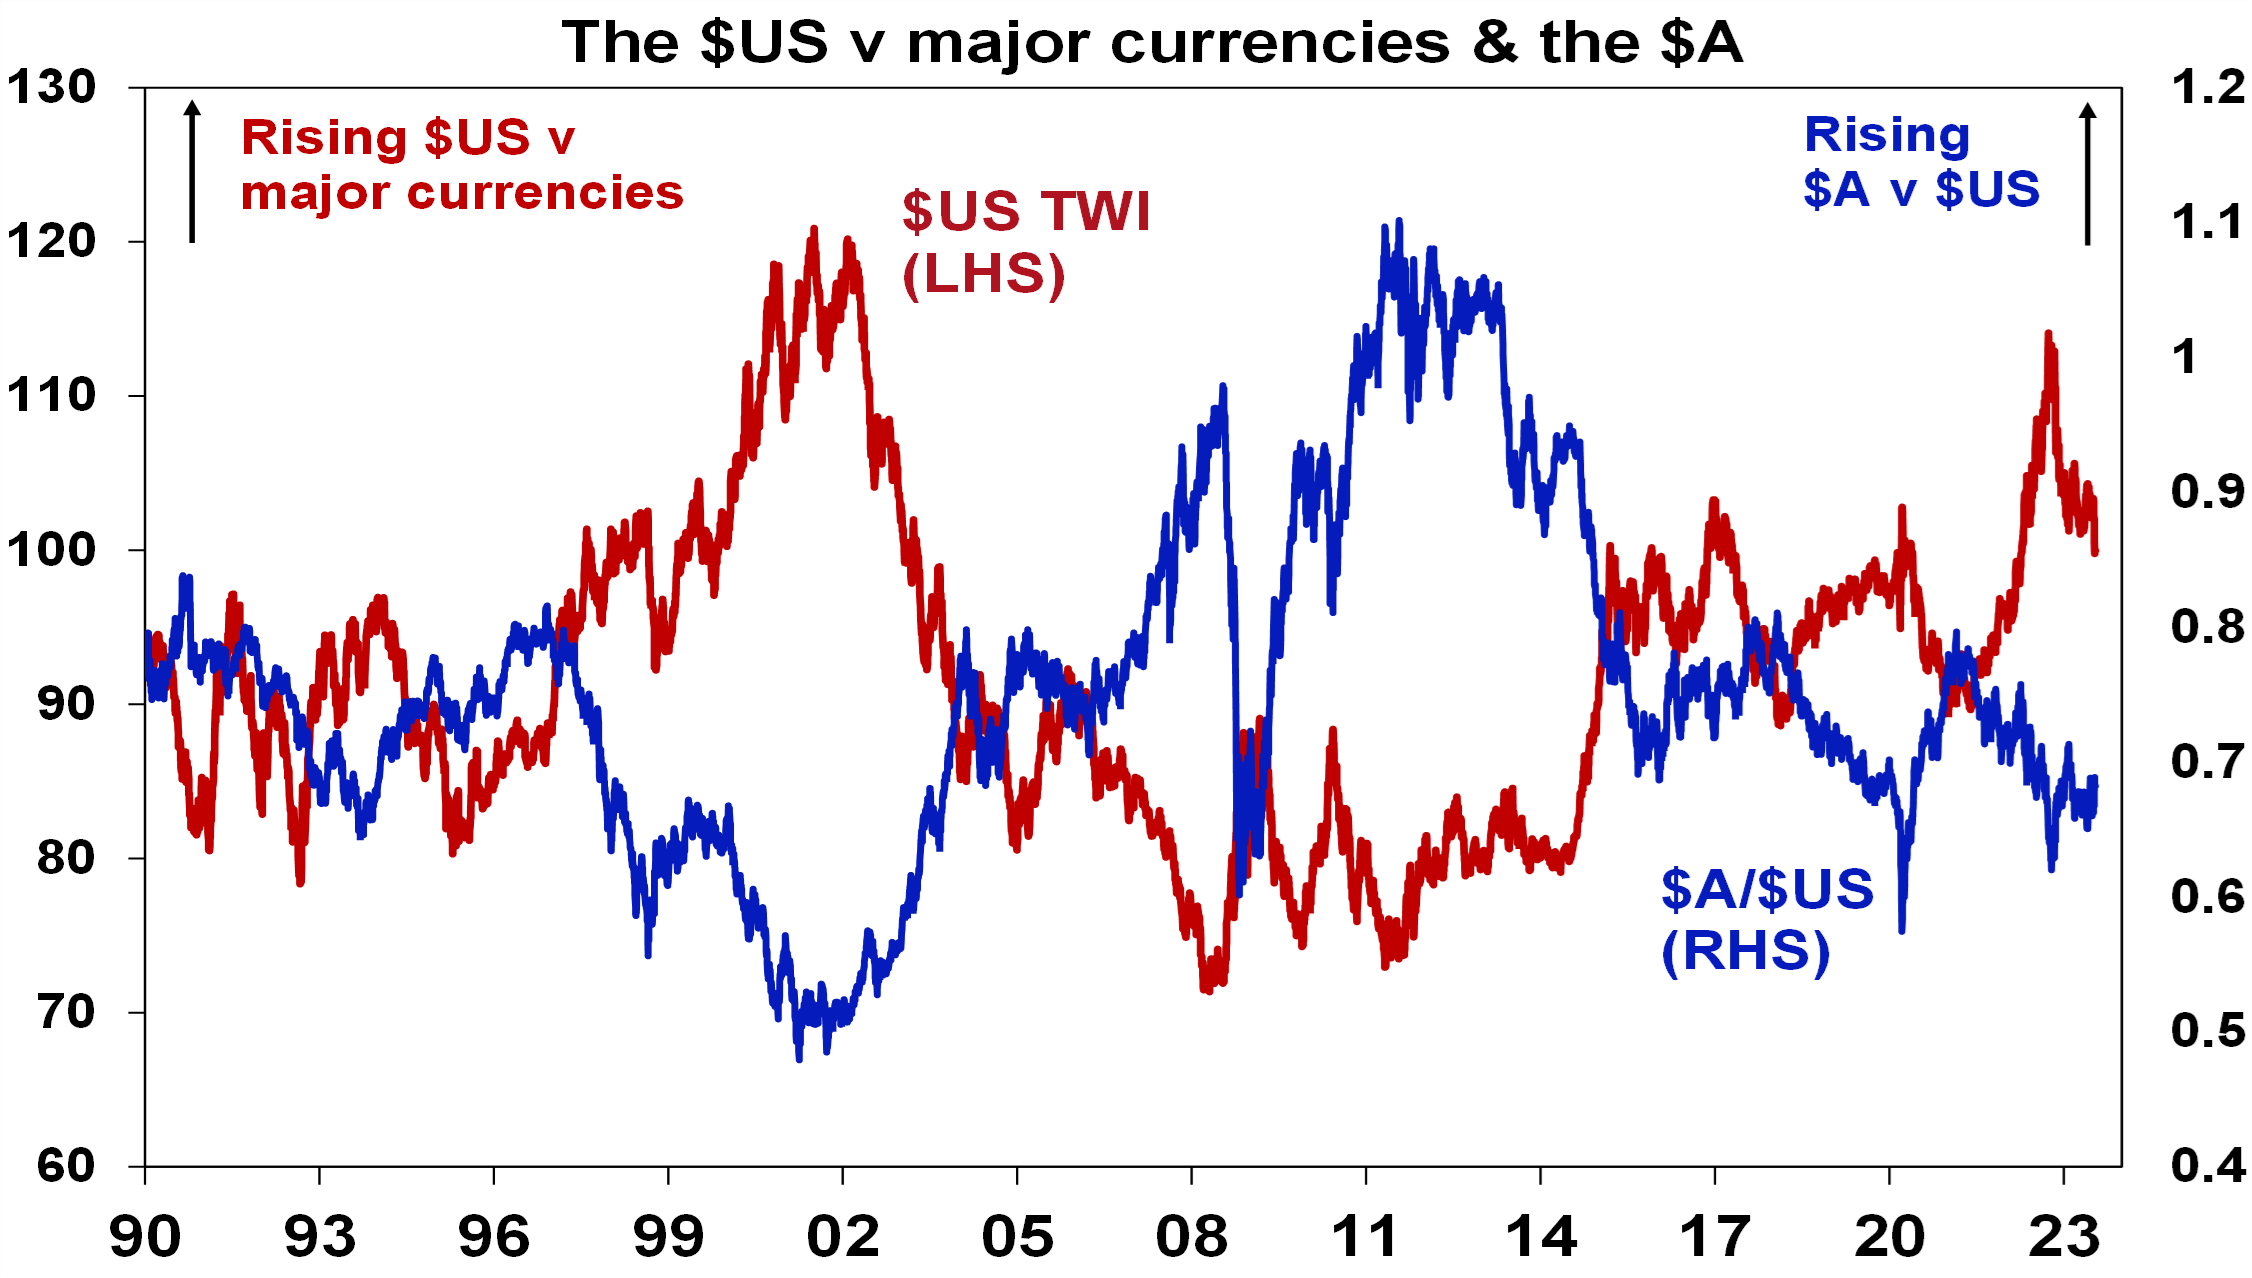
Chart 7 – the US dollar
Due to the relatively low exposure of the US economy to cyclical sectors (like manufacturing), the $US tends to be a “risk-off” currency. In other words, it goes up when there are worries about global growth and down when the outlook brightens. An increasing $US is also bad news for those with $US denominated debt in the emerging world. So, moves in it bear close watching as a key bellwether of the investment cycle. Last year the $US surged with safe haven demand in the face of worries about recession, war and aggressive Fed tightening. Since September though it has fallen back as inflation and Fed rate hike fears eased and geopolitical risks receded. And after stalling over the last six months, it’s since broken down again. A further downtrend in the $US would be a positive sign for investment markets this year, whereas a sustained new upswing would suggest they may be vulnerable. So far it’s going in the right direction.
Source: Bloomberg, AMP
Source: AMP
Unintended consequences of Government COVID-19 Policies
By visual /May 13,2020/

For every action there is a reaction. And while we’re not criticising the government’s policy response to COVID-19, we recognise that such intervention often has unintended consequences.
Take lower interest rates for instance. Central banks intended to make the cost of investment cheaper and be stimulatory. Instead, Australian households borrowed more money to buy bigger and better houses and US corporates levered up to buy back shares. Both actions have contributed to the economy’s current precarious situation.
One needs to think laterally when considering unintended consequences, something we apply our collective minds to. Why? Unintended consequences can impact the long-term prospects of companies and industries, both positively and negatively.
A costly decision
Providing a payment holiday seems like the right thing for banks to do given the unique circumstances. However, is it simply delaying the inevitable?
While a payment holiday means you don’t have to pay principal or interest over a six-month period, interest still accrues. In other words, after the payment holiday you have more debt. Imagine if the asset against that debt, maybe your family home or investment property, is worth less in six-12 months’ time. That leaves you with a higher liability and lower asset value.
If the servicer of the loan cannot find a job and is forced to sell in a depressed market, this becomes permanent financial damage. The unintended consequence of a payment holiday for SMEs and households could be a bigger problem down the track.
Credit rationing
Banks are experiencing significant demand for credit from existing customers. SMEs and households are getting payment holidays and larger corporates are drawing down any credit line they can. This is extremely capital consumptive for banks.
While the RBA is providing adequate liquidity and the government is providing motivation to extend credit to SMEs, there’s little motivation for banks to take on new customers, either consumers or SMEs. We believe credit rationing for new customers is likely, with non-bank lenders pulling back at the same time. This will provide a headwind for the economy, with a reduced number of business start-ups in the short to medium term.
Commercial property
SMEs are most likely to use retail and office properties. To keep SMEs afloat, the government is addressing the two biggest costs, one of which is rent. The government has set up rules for a Mandatory Code of Conduct which helps tenants with turnover up to $50m. Essentially, the commercial landlord must take the same revenue hit as the tenant. At least half of this rent is waived completely, and the rest is deferred.
This is a smart move politically because there’s a perception that commercial landlords are rich, so there’s little sympathy from the public. However, unintended consequences are likely.
Commercial property is an attractive investment for two reasons; the stability of cashflows and the ability to borrow large sums of money against the asset. Landlords generally don’t get to participate in the upside when a tenant’s sales are going through the roof, but on the flip side, when the going’s not so good, they still get paid or can replace the tenant.
Banks traditionally liked lending to commercial property owners because of stable cashflows, the security of a hard asset and there wasn’t that operating leverage as is the case in most businesses. A precedent has now been now been set.
Commercial landlords now must cop the downside being felt by their tenants. There is even a six-month moratorium on evictions; so this asset, which was generating cash and servicing a debt, is generating no cash and there is nothing the landlord can do about it.
When the dust settles, banks are going to want more collateral and will likely lower loan to value ratios at a time when values could be under pressure. Given the importance of debt finance for most commercial property investors, this is likely to negatively impact valuations in the medium term.
The unintended consequences could include landlords hiking rents to take this new risk into consideration. If unable to increase rents, the result could be an accelerated downcycle in commercial property valuations, which would provide a further headwind for credit providers, which in turn could lead to further credit rationing.
Policies being implemented today have numerous unintended consequences that may impact the long-term prospects of many industries. This includes changes to supply chains from global just-in-time inventory systems to relying more on domestic supply chains. Immigration may slow to a trickle which, in turn, will impact economic growth.
Source: Perpetual
Economic Update
By visual /May 13,2020/

Market and Economic overview
Australia
The coronavirus ‘curve’ of known cases has flattened out, suggesting social distancing measures have been successful in slowing the spread of the disease.
The focus is now on a gradual easing of restrictions – people will gradually start returning to work as non-essential areas of the economy start to function again.
It will take time for conditions to normalise completely – borders remain closed to overseas visitors, for example, so tourism-related areas of the economy will continue to struggle.
It remains too early to say how significant the slowdown will be, but some observers have suggested the Australian economy could contract by approximately 5% in 2020. At the same time, consensus expectations suggest unemployment could double, from around 5% in February to perhaps 10% during the course of this year.
Job security is low and house prices appear likely to fall, which could further dampen sentiment. For now, credit card spending is running nearly -20% below the corresponding period a year ago, highlighting the current weakness in consumer confidence.
United States
By the end of April, more than 1 million people in the USA had been diagnosed with coronavirus.
Like other countries, the US had implemented various closures and restrictions. The ‘30 Days to Slow the Spread’ expired on 1 May 2020 and President Trump has suggested social distancing restrictions will not be extended.
Trump appears determined to reopen the economy as soon as possible, against the recommendations of some medical professionals. Ultimately, he wants the economy firing again in the run-up to the Presidential election in November.
The latest data showed the world’s largest economy shrank at an annual rate of -4.8% in the March quarter, even worse than consensus forecasts.
The downturn was due to economic disruptions in March. Data for the June quarter is expected to be worse still given more extensive closures during April, at least.
Europe
Much of Europe remains in lockdown, although numbers of cases vary quite markedly across the region. Germany – the largest economy in Europe – has much fewer cases than some other countries such as France, Italy, Spain and the UK. The economic impact might therefore differ between countries but will undoubtedly be significant overall.
Euro Area GDP growth declined at an annual rate of -3.3% in the March quarter and is expected to fall further in the June quarter.
Annual growth rates were lower still in some of the region’s major economies: France -5.4%; Italy -4.8%; and Spain -4.1%.
New Zealand
Restrictions have been eased in New Zealand; ‘Level 3’ measures are now in place – similar to those in Australia – after the more stringent ‘Level 4’ lockdown was no longer deemed necessary.
The Reserve Bank of New Zealand remains very active with its recently introduced asset purchase program. The Bank is buying large amounts of government and local authority bonds to ensure the smooth operation of the local fixed income market.
Asia
China’s economy shrank at an annual rate of -6.8% in the March quarter; a sharp slowdown from the 6.0% year-on-year growth seen in the December quarter of 2019.
The industrial sector was hardest hit by the near two-month shutdown of non-essential parts of the economy.
Whilst alarming, the short-term contraction will not impede China’s long-term growth trajectory, according to officials. That said, conditions could remain subdued in the foreseeable future.
Australian dollar
The Australian dollar clawed back all of its lost ground from March. The currency gained 7.0% against the US dollar, closing April at 65.5 US cents. Similar strength was seen against other currencies too.
Commodities
Most commodity prices finished the month of April stronger as demand uncertainty eased. Following sharp falls in March, copper (8.0%), nickel (8.0%) and zinc (3.4%) posted solid gains, although not enough to recover previous losses.
Iron ore (1.4%) reversed its downward trend on signs of a turnaround in Chinese manufacturing activity and reflecting China’s economic stimulus plans.
Oil prices (WTI Crude -26.6%) continued to fall, although stemmed losses towards month end on evidence of falling production.
The gold price (7.6%) again proved resilient against a backdrop of ongoing market uncertainty, while platinum (9.8%) and silver (10.1%) bounced back after March’s sharp falls.
Australian equities
The equity market recovery in the last week of March continued throughout April. The S&P/ASX 100 Accumulation Index rose 8.4%, registering its strongest monthly return since 1988.
Confidence was initially supported by the huge monetary and fiscal responses to the pandemic and later by encouragement that social distancing restrictions were proving effective.
The full impact of the virus remains unknown, however, and the shock to company earnings and balance sheets has placed additional pressure on dividend policies. At the same time, most companies have withdrawn earnings guidance.
Australia’s banks continued to underperform, as delays to mortgage payments and decreased property activity threaten earnings. The growing prospect of dividend cuts and the view that the banks will play a key role in supporting the economy has further dragged on investor sentiment.
Listed property
After plunging dramatically in March, global listed property markets rebounded in April. The COVID-19 situation continues to be the dominant driver of property securities. Due to virus containment measures globally, including widespread lockdowns, there are rising expectations for sweeping rent abatements across the sector, particularly in the most heavily hit sub-sectors such as discretionary retail. Many listed property securities globally have now withdrawn their earnings and dividend guidance due to the uncertainty.
Global equities
Unprecedented levels of monetary and fiscal support helped global markets stage a remarkable recovery. The MSCI World Index bounced 10.6% in local currency returns in April – its strongest month since 1975. The appreciation of the Australian currency tempered global equity returns for domestic investors, with the MSCI World Index rising ‘only’ 3.7% in Australian dollar terms.
UK equities were the weakest performers in April, with oil giant Shell announcing a cut in its dividend. Financial stocks also weakened after Lloyds revealed a large drop in profits. Disappointing returns from energy and financials stocks have contributed to the underperformance of the MSCI World Value Index in recent months.
Global and Australian Fixed Income
Bond markets were substantially calmer in April compared to March as central bank support programs appeared to be having their desired effect.
The Reserve Bank of Australia, for example, has bought around $50 billion of government and state government bonds in the past few weeks. This has materially improved liquidity and helped steady the local bond market.
Benchmark 10-year US Treasury yields closed April just 0.03 percentage points lower, at 0.64%. Yields also declined in the UK, Germany and Japan, by 13 bps, 12 bps and 5 bps, respectively.
Australian yields moved in the opposite direction, though not significantly. The yield on 10-year Commonwealth Government bonds closed the month 13 bps higher, at 0.89%. This resulted in a modest negative return from the domestic bond market.
Global credit
Like shares, corporate bonds were buoyed by an improvement in risk appetite globally. Credit spreads – the difference in yield between corporate bonds and comparable high-quality government bonds – narrowed substantially.
Companies looked to take advantage of improving risk appetite and strong inflows into the asset class by offering a substantial amount of new bonds. In some cases, this was to bolster their balance sheets to help cushion the impact of a more prolonged period of lower profitability.
Source: Colonial First State
Funding retirement income in a low interest rate environment
By Robert Wright /November 23,2017/

While a traditional bank deposit is generally regarded as one of the safest forms of investment, it also currently offers among the lowest returns. For those relying on bank deposits to fund their retirement income, the current record low interest rate environment offers little reward.
For those approaching retirement, low interest rates could mean having to rethink their retirement goals, retirement time frame and potential sources of retirement income. For existing retirees, it could mean having to re-assess their goals. Simply put: low interest rates means more capital is required to fund future income needs.
This raises the question – if interest rates stay low for the foreseeable future, how can you fund the retirement lifestyle you’d hoped for?
Regardless of whether you are preparing for retirement, or are already retired, the answer lies in focusing on factors you can control, rather than those you cannot. Whilst there are many aspects of investing that can’t be reliably predicted, there are many factors you can control, including:
- how much you spend;
- how much you save;
- how much investment risk you are prepared to accept;
- how you structure your investments; and
- how much you pay in fees.
For those still working, it could mean adjusting discretionary spending, so that more funds can be used to boost retirement savings, or additional mortgage payments can be made to reduce the amount owing, or a combination of both. Less spending now means more money for later.
For self-funded retirees, it could mean adjusting discretionary spending by taking fewer ‘big’ holidays or by considering the Age Pension in their future planning.
Inevitably, investors may feel compelled to move further along the risk curve to seek out the retirement income they desire. In other words, they may seek to diversify away from cash and invest a higher percentage of their capital in alternative forms of income producing assets – such as shares, property and infrastructure. This is often referred to as the ‘search for yield’.
Cash vs Alternative Income Assets
The cash rate in Australia is currently 1.50%, with some institutions offering around 3.00% depending on the deposit amount and timeframe. Compare this to shares, where it is possible to receive a 6.00% return (or more), often with the benefits of franking credits.
There are, of course, risks associated with growth assets that can’t simply be ignored, and investors need to feel comfortable that the value of their portfolio will fluctuate over time, as the assets respond to prevailing market conditions. Whilst a regular dividend can help to offset the impact of any future share price falls, there is no guarantee that dividends will continue to be paid at the same rate.
Managing investment risks can be achieved by:
- buying and holding quality assets;
- being prepared to stay invested for the long term; and
- being prepared to ‘capitalise’ on over-heated markets.
Structuring your Assets
The overall structure you employ is the foundation to your portfolio and impacts the net return you receive. Quality assets, poorly structured, can lead to lower real returns.
For self-funded retirees, the decision to hold assets via a super fund or account based pension, or in their individual names can lead to very different results, in the form of:
- Returns – some structures don’t pay tax on earnings, so holding assets in the right structure can lead to higher returns.
- Benefits – some structures offer Centrelink exemptions, so holding assets in the right structure can lead to increased entitlements.
Understanding the difference between structures, and how these relate to you, can be complicated as they relate to an individual’s personal circumstances. This is one area that is definitely not “one size fits all.”
Fees
The fees you pay, whether direct or indirect, will also impact the net return you receive and can make a significant difference over the long term. Fees can generally be categorised into three areas:
- Administration
- Investment
- Advice
It is important to have a good understanding of the total fees you are paying, to be satisfied that you are getting “value for money.”
As outlined above, it is clear that there are many factors to consider when it comes to deciding which approach is best for you. Now, more than ever, due to the current low interest rate environment, it’s worth reviewing your overall position to determine whether your current strategy remains relevant to your needs and lifestyle. Please contact us to discuss your particular situation.
Source: Capstone