
Tag Archives: Investing
Protecting retirement income from inflation
By Robert Wright /August 22,2025/

The fall in inflation from multi decade highs is good news for the Australian economy. Many retirees are struggling to manage their cost of living because of the cumulative impact inflation has had on their financial position.
Looking forward, retirees need a portfolio that is protected from inflation risks so that they don’t experience another cost of living crisis when inflation has another upturn.
Maintaining the long-term real value of investments
The key to a successful investment strategy is the ability to generate returns over the long term. Managing inflation is an important piece of the strategy. Long-term investments need to be able to generate a real rate of return that provides growth in the investment value. The investments do not need to capture short-term inflation changes, but they need to offset the impact of inflation over time. Assets that are expected to do this are generally referred to as ‘growth’ assets. To demonstrate this, we can look at the historical performance of assets over the long run1. Looking at Australian investment returns between 1900 – 2023, equities provided a return higher than inflation in 81 years which was 73% of the time. The one-year success rate for bonds and bills (cash) were lower, constrained by historical limits on bond yields. Both bonds and bills provided a one-year real return only 62% of the time in the same period.
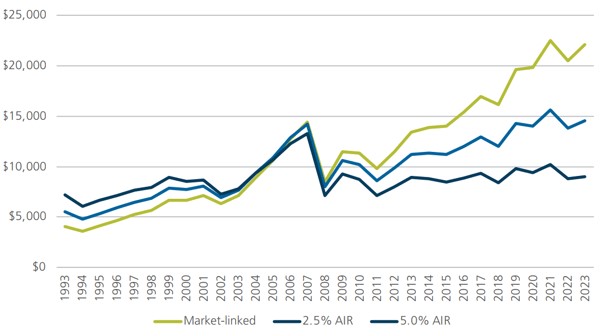
The long run probabilities are shown in Figure 1. As the investment horizon extends out, up to 25 years, the probability of equities providing a real return increases. The higher returns on the investment eventually overcome any initial shortfall. Bond and bill investments show little improvement with a longer investment horizon2. At horizons of 20 years, the probability of delivering a positive real return from nominal bonds was only 60%. Historically, all investment horizons of 16 years (and longer) have provided a positive real return for Australian equities. While history does not provide a guarantee, the increase shown in Figure 1 should provide confidence that a long-term investment in equities will provide real capital growth. This analysis can be extended to diversified products such as a 70/30 growth fund (70% equities and 30% bonds) and a 50/50 balanced fund (50% equities and 50% bonds). These both show trend improvements over time, benefiting from the exposure to growth assets, but over longer periods. The 70/30 fund needed 20 years and the 50/50 fund 25 years historically to ensure the positive real return.
The portfolio comparison in retirement is important in the generation of income over longer periods. If income is taken as a set percentage of the balance than changes in income will directly link to market movements. Also, there are market linked annuities available in Australia where the capital is consumed but the income, which is paid for life, will be directly linked to the performance of the specified market or underlying investments. This paper provides a historical basis to consider the inflation protection provided by these income streams. Historical investment performance is not a reliable indicator of future performance, but it is worth considering the timeframe for recovery from historical shocks.
Figure 1: Historical probability of positive real returns, 1900-2023
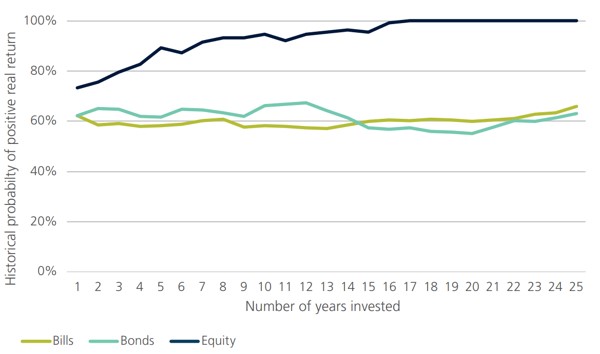
Source: Calculations, based on data from Morningstar, S&P, Bloomberg and ABS
Inflation risk in retirement
Inflation is often called out as a risk in retirement that needs to be managed differently. Longevity and sequencing risks are also noted as being different, and these are not present in the accumulation phase. One of the challenges with managing inflation risk in retirement, is that inflation risk has a different impact on a portfolio in the retirement phase. Management of inflation risk in retirement needs a different approach. It is not just that capital needs to regain its real value, but every income payment needs to keep its value to maintain the target lifestyle of the retiree.
We can examine this difference by considering the outcome for someone who started to draw an income at the start of 1973. This was one of the worst years in the historical comparison where the inflation spike meant that any investment linked income would be falling in real terms in the first year. If a retiree’s income was linked to an investment, the real value would have declined for any of the three assets: Bills by 3.5%; Bonds by 26% and Equities by 30.7%. What happens over time is the recovery in the level of income. Income linked to equity performance briefly exceeds the original value in 1980 but dips again before maintaining real gains from 1983. Bills provide higher real income from 1985 while bonds will take until 1992. The 19 year impact on bonds highlights the exposure that nominal bonds have to inflation risks. The pattern for income linked to the different markets from 1973 can be seen in Figure 2.
Figure 2: Investment-linked income example
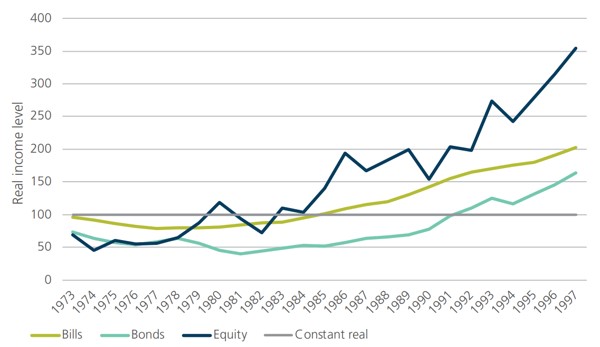
Source: Calculations, based on data from Morningstar, S&P, Bloomberg and ABS
There is more at stake for retirees. The impact is not just the length of time to recover the real capital value, but the income that is lost over that period. For the nine years that the real equity linked income is under the starting point, a retiree needs to reduce their lifestyle or run their capital down early. The shortfall is shown in Figure 3. It highlights the cumulative shortfall in income, relative to the initial lifestyle of the retiree. The starting point is where inflation risk creates an impact which might be after the start of retirement.
The shortfall highlights the extent of the impact from an inflation shock. The worst performance is from bonds, where more than 7 years of income (lifestyle) were lost over a 17-year period before a modest recovery. For equity-linked income, nearly three years of lifestyle were lost over nine years. While there was a strong recovery after, this is an average of a third of total spending that needs to be cut for an extended period. Cash investments took longer to fully recover, but the extent of the pain was not as large. The worst point is ten years after the shock, where the retiree has missed 1.7 years of real spending.
Figure 3: Cumulative shortfall in real incomes
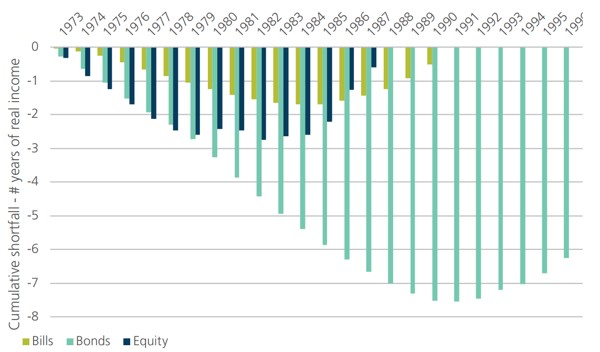
Source: Challenger calculations, based on data from Morningstar, S&P, Bloomberg and ABS
The extended pain highlights why inflation risk is an additional risk to consider in retirement. It is not just the capital recovery, but it is the lost lifestyle that happens when an income stream does not keep pace with inflation. Retirees that choose a market linked income stream need to have the capacity to sustain a potential extended period of reduced lifestyle before they can enjoy an increased lifestyle later in retirement.
Payment profiles and income indexation
The analysis so far has highlighted how inflation shocks can impact a lifestyle based on an initial spending level. In practice, not all spending profiles are the same. The different approaches to generating income provide differing levels of starting income. Some differing options for indexation of an income stream include:
- CPI linked lifetime income
- Market linked lifetime income3
- Accelerated payments with market-linked lifetime income
A CPI linked lifetime income stream sustains the lifestyle of the retiree by adjusting their payments with changes in the cost of living. A market linked income stream uses an indirect approach, that requires market movements to exceed CPI inflation over time to maintain the lifestyle of the retiree. Accelerated payments are designed to smooth the income profile of market linked income streams. Recognising that payments are expected to grow over time, some of the income can be front-loaded by indexing the payments by a fixed percentage lower than the market return. This provides a higher starting payment that will grow more slowly. This fixed percentage is sometimes called the assumed investment rate (AIR). The analysis includes payments for an AIR of 2.5% p.a. and 5% p.a. The difference in the initial payment rates as shown in Figure 4 can be substantial.
Figure 4: Initial payment rates
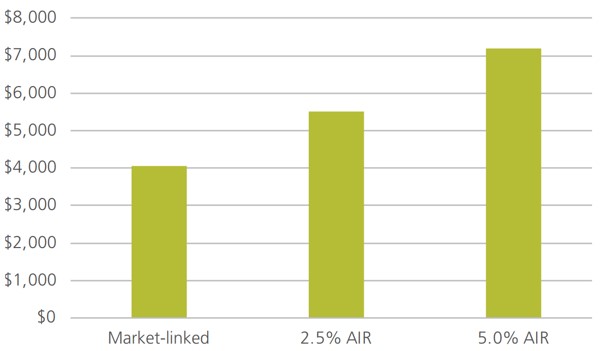
Source: Challenger, as at 8 April 2024
Current rates provide a range of starting payments, per $100,000 of around $4,000 to $7,000 a year, for a 65 year old male. A market-linked lifetime annuity with a 5% AIR has payments starting at a rate 78% higher than one with no AIR. Over time the payments will increase by 5% less each year so over time the payments will cross over. This wedge is independent of market movements.
The paths for the 30 years from Dec 1993 to Dec 2023 can be seen in Figure 5. This shows the five-fold increase for payments that were linked to the accumulation performance of the S&P/ASX200 over that time. The 5% AIR hurdle provided the highest initial payment, but lower indexation meant that this would not have been the highest after 2004, only 11 years into retirement. The smaller increase in the payments with a 5% AIR would not have kept up with inflation from the initial payment level. It provided a flatter spending profile that declines in real terms.
Figure 5: Market-linked payments over time
Source: Challenger, S&PASX200
Dividend strategy
Another approach with an equity investment is to use only the dividend payments for retirement income. Dividend yields tend to be counter cyclical so dividends are not as volatile as share prices. The question is how well they keep up with inflation over time. Again, we can use the available historical data4 to see what might have happened. One difference is that none of the dividends are reinvested. When dividends are higher, a market linked strategy effectively reinvests the excess. A dividend strategy spends this excess which has an impact over longer horizons.
Another difference with a dividend strategy is the starting income levels. The starting income reflects the dividend yield available at the time, with no consumption of capital over time. The first challenge is to see if the dividends protect from inflation for the given starting level. Figure 6 highlights how the dividend strategy does not provide the same level of protection of an equity market-linked strategy. It begins with a 60% success rate, similar to the equities market linked strategy with a 5% AIR. Over time, the success rate improves, but it does not match an equity market linked strategy. Historically, dividend growth over 25 years was below inflation in 10% of the scenarios. The earliest in this sample was 1929-1954 and the latest was 1969-1994.
Figure 6: Inflation protection of a dividend strategy
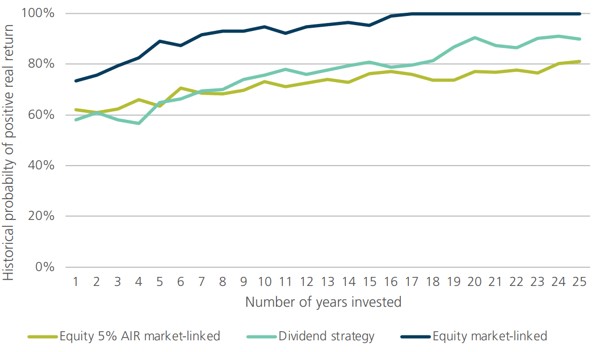
Source: Challenger calculations, based on data from Morningstar, S&P, BHM, Bloomberg and ABS
The dividend strategy maintains the capital invested in the underlying equities so the income payments will be lower than what can be achieved if the capital is consumed over retirement. On average, the dividend yield has been 4.65% p.a. and is currently 5.2% including franking credits. Investors might expect inflation protection similar to an equity linked 5% AIR investment. In practice, the initial income is lower with a dividend strategy, but the lower income is better protected than the 5% AIR strategy. However, it can take a long time to catch up the initial income gap.
Another impact of maintaining the capital is that the dividend strategy does not increase payments at older ages. The comparison to market linked lifetime income streams is shown in Figure 7 which shows that only the market-linked strategy with a 5% AIR has a higher initial payment at age 65, but by age 75, the dividend strategy provides lower payments than any of the other strategies. This demonstrates that a dividend strategy supports a lower lifestyle than a strategy that will consume capital over time. Retirees are unable to maximise the money available to spend through retirement if they do not draw down on their capital.
Figure 7: Initial payment rates per $100,000 investment at different ages
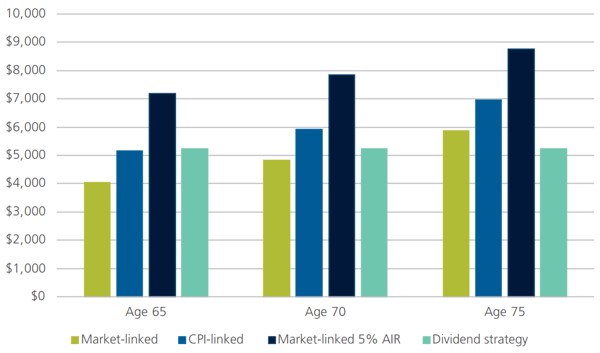
Source: Challenger as at 8 April 2024 with calculations based on S&P data as at Dec 2023
Age Pension
Another consideration for retirees thinking about inflation protection is their entitlement to the Age Pension. Around two in three current retirees receive at least a partial Age Pension, and while this is likely to decline, a significant proportion of retirees will continue to receive some Age Pension in the future. The Age Pension provides an income stream that automatically increases with inflation. Over time, it will also increase with real wages growth, but the real wage declines in recent years mean that it is probably still several more years until the Age Pension will increase more than inflation. The mechanics of the Age Pension indexation can result in retirees receiving a partial Age Pension being over compensated. The full Age Pension payment is indexed and any means tested amounts are calculated relative to the new full payment. While earned income is likely to increase with inflation, the assets held by an asset tested pensioner might increase by less than inflation, or even fall. In this case, the proportionate increase in Age Pension payments might be higher than inflation reducing the need to fully protect a retirement portfolio from inflation. This protection is provided only up to the value of the Age Pension. If a retiree has any lifestyle requirements above the safety net provided by the Age Pension they need to be fully protected against inflation.
Conclusion
Protecting an investment portfolio from inflation can be an important concern for any investor. In retirement, the challenge increases as a retiree needs to protect their income stream to be able to sustain their lifestyle. While some investments can protect against inflation over the long run, market linked investments don’t necessarily protect an income stream from inflation over the short to medium term. Retirees who want to be able to maintain their lifestyle need the inflation protection that can be provided by a CPI linked income stream. The Age Pension will deliver some of this for retirees, but those with a lifestyle goal above the Age Pension’s safety net will need an additional source of inflation protected income.
1 The historical data in this paper comes from the Dimson, Marsh and Staunton dataset as provided by Morningstar. Recent data on indices relates to the S&P/ASX 200 Accumulation index, Bloomberg AusBond Composite 0+Yr Index and Bloomberg AusBond Bank Bill Index. Recent inflation data is the CPI sourced from the Australian Bureau of Statistics.
2 The majority of these periods were between 1933 and 1973 when bond yields were set by regulation.
3 Different market-linked options are available, but the initial payment is the same for each option.
4 Historical data is calculated as the difference between Accumulation and price returns in the BHM dataset: Brailsford, T., J. Handley & K. Maheswaran (2012) The historical equity risk premium in Australia: Post GFC and 128 years of data. Accounting and Finance Vol52.1 pp237-247. Franking credits have been included for the period post 1987
Source: Challenger
Navigating market volatility
By Robert Wright /May 23,2025/

Financial markets have been erratic lately, understandably causing some concern for those of us with super and investments. While dips and major market events are a common feature of investing, markets generally trend upwards over time.
Most super funds invest in sharemarkets to help your money grow over in the long term. So when markets see-saw, so do super and investment balances and returns.
While this can be worrying, it’s important to remember that although the value of investments may go up and down at different times, markets tend to recover and grow over the long term. So it’s important to keep your long-term investment goals in mind.
What’s happened recently?
On 3 April, President Donald Trump announced the US would place tariffs on goods imported into the US from countries around the world. This included a 10% tariff on goods from Australia, which was the minimum rate announced on the day.
Major global economies and markets had been preparing for the announcements, but the tariffs imposed on some countries were bigger than expected. Other countries have also responded by putting similar tariffs on US goods coming into their markets.
As a result, share markets in the US and elsewhere fell sharply in the days afterwards, including the Australian Stock Exchange.
What is a tariff?
A tariff is a tax added to the cost of goods imported from a particular country or countries. It is paid to the government where the goods are being imported.
Tariffs are often used to protect domestic industries by increasing the price of foreign-made competitor products, or to raise revenue.
The cost of those items to the public will generally increase by a similar amount to the tariff.
What does this mean for markets and investments?
The US tariffs are expected to slow global trade and push up the price of some things, which could cause inflation to rise.
This could result in the Reserve Bank of Australia cutting the interest rate several times this year to prevent the economy from slowing down too much.
In the short term, you may see a negative effect on the performance of investments.
Short term volatility in response to political announcements and other geopolitical events is a common feature of investment markets.
While difficult to forecast, history shows us that markets do recover from disruptive influences – for example, from the Global Financial Crisis and the COVID-19 pandemic.
What led to this?
Since Trump’s second presidency began, uncertainty has emerged about US policy in the areas of tariffs, defence and other critical areas of government spending.
In recent months, shares have been quite weak, particularly US technology stocks. This group of stocks was optimistically priced after two years of strong growth, and therefore most at risk of uncertainty in the US market.
This has unsettled businesses amid concerns the US economy could slow. It has also fed into uncertainty in global investment markets, including the Australian sharemarket.
What does this mean for me?
As global financial markets move up and down, the value and returns of your super and investments may also change in the short term.
While this can be concerning, history shows that markets rise over time. So it’s important to keep your long-term savings and investment goals in mind and carefully consider before making any changes to your investment strategy.
It’s understandable at times like these that some members think about changing how their money is invested. As this chart shows, the long-term trend across major investment types is positive, with shares experiencing more volatility but generating higher returns than more conservative options such as cash.
While past performance is not a guarantee of future performance, historically more time invested in the sharemarket has meant a higher return on investment.
How different investment types have performed over 20 years
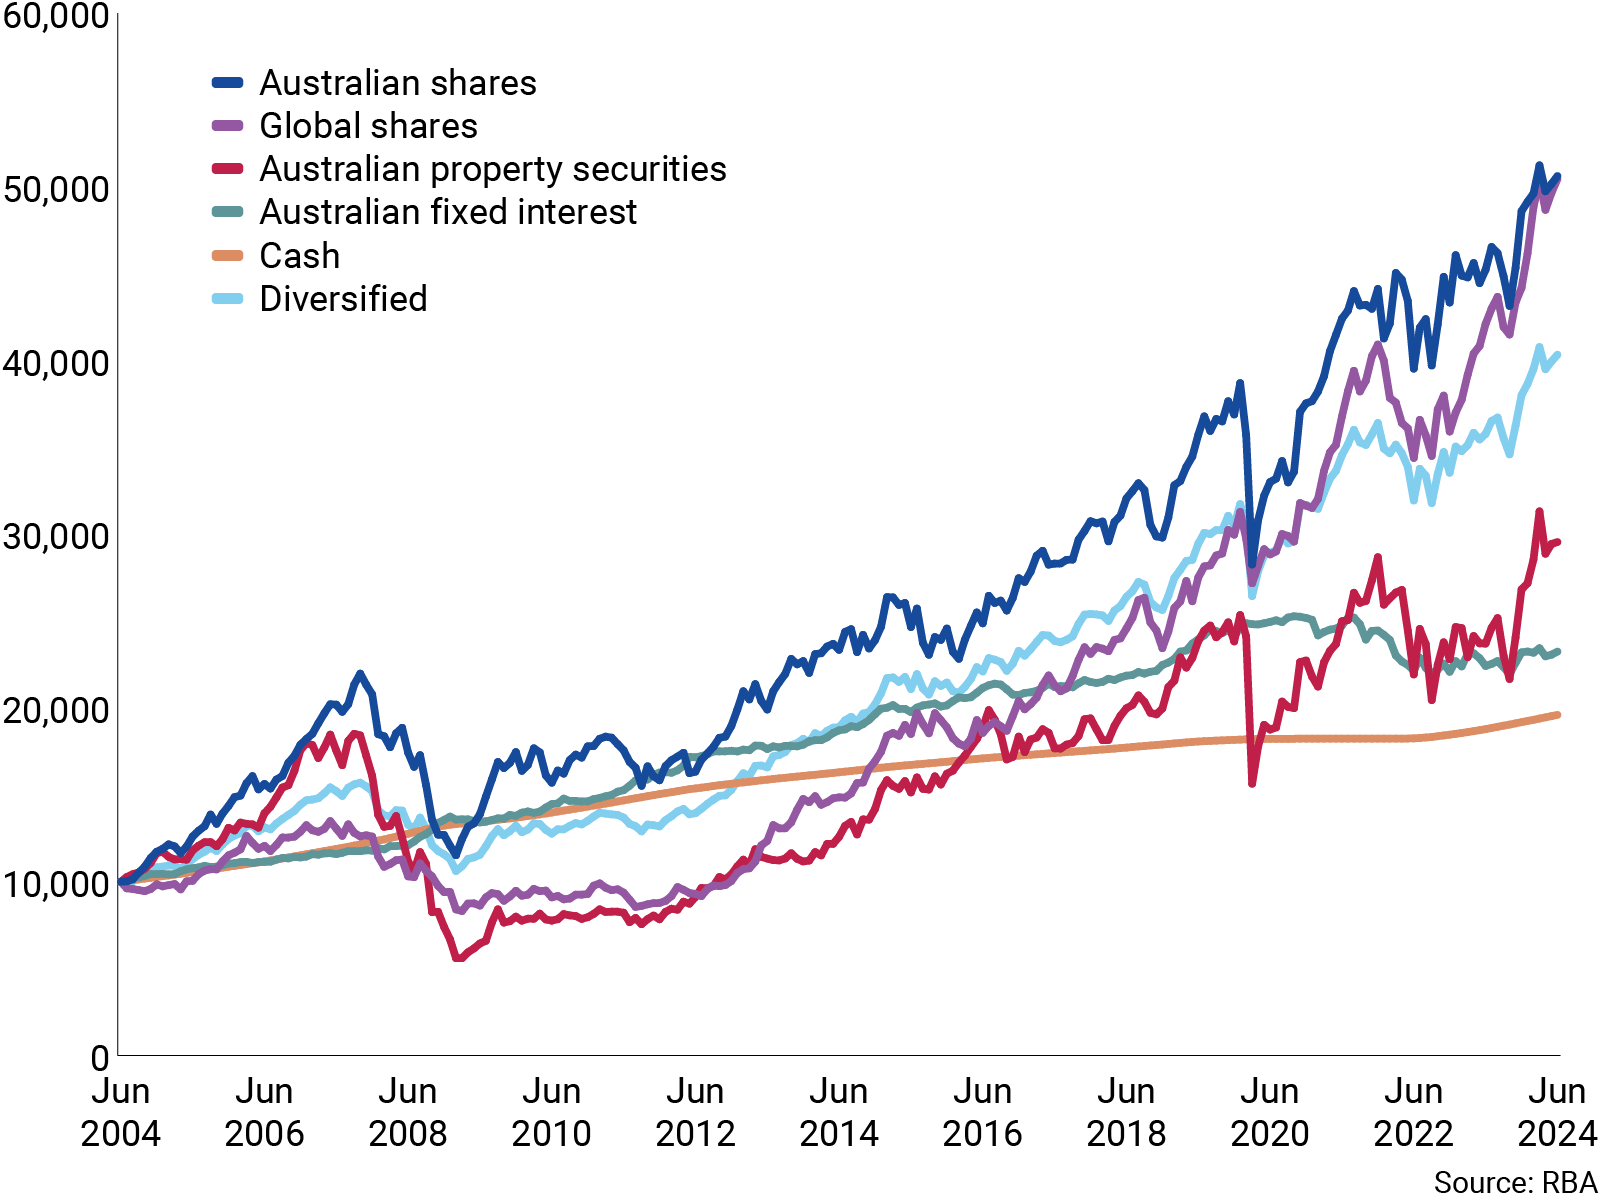
It’s also worth noting that investment performance has generally been strong over the past two years, meaning the value of your investments or super may have been relatively high.
Do I need to do anything?
As with any significant market event, it’s best to avoid impulse reactions, but to take a long-term view.
Source: CFS
Megatrends for 2025 and beyond…
By Robert Wright /February 28,2025/

Megatrends are long-term structural changes that affect the world we live in. Importantly, they shape communities but they also create investment opportunities and risks. Learnings from historical megatrends include: 1) they often solve a problem through innovation; 2) the scope of the megatrend can initially be underestimated; and 3) the duration of a megatrend is typically longer than anticipated. There are numerous megatrends likely to influence markets that investors should consider: the shift to the cloud and generative AI, the ageing population, rising geopolitical tensions and so on. Today we highlight just some of the current megatrends.
The continued growth in “winners take all” dynamics
A megatrend that continues to play out is growth in “winner take all” or at least “winner takes most” dynamics in the global economy. Reduced cross-border frictions, the growth in digital goods and distribution channels, and the increasing importance of scale and network effects have allowed companies to scale to a size almost unimaginable in the past.
The rise of the so called “magnificent seven”, the group of leading US technology companies, is a good example of these forces playing out. This group now accounts for a higher share of global markets than the leading companies of the tech bubble era of the early 2000s. However, unlike that time, their size today has predominantly been fuelled by enormous growth in revenues and profitability, albeit some speculative elements may have played a part more recently.
A key risk for some of these businesses is antitrust. Microsoft, Apple and Alphabet have recently attracted the attention of the antitrust authorities, with increased competition the primary motive. We view that it is a low probability that regulators break up these businesses, meaning the underlying economic forces will continue to allow successful businesses to scale far more quickly and to far larger sizes than historically was the case. This presents a significant opportunity for global investors, as these companies can deliver outsized returns. On the other hand, these trends also increase disruption risks to legacy businesses and industries.
To benefit from the former and guard against the latter, investors should focus on quality companies that have strong and enduring competitive advantages. These advantages typically include scale, pricing power, brand strength, network effects and intellectual property.
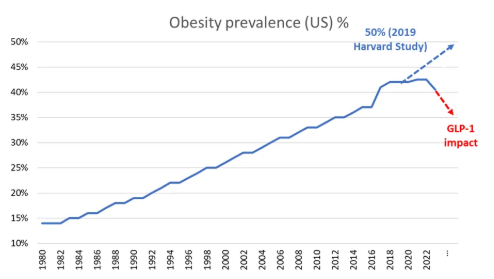
Glucagon-like peptide-1s (GLP-1s) and solving obesity
One of the biggest health issues facing developed countries is obesity. The development of the GLP-1 class of weight loss drugs such as Ozempic promises to transform the treatment of obesity and significantly improve health outcomes for societies. GLP-1s stimulate the brain to reduce hunger and act on the stomach to delay emptying, so you feel fuller for longer, have a lower calorie intake and lose weight.
Take up is likely to be strong over coming years as supply constraints ease and continued innovation delivers a more convenient oral pill and mitigates potential side effects such as nausea. Growing clinical evidence of health benefits, such as lower risk of heart problems, will also encourage governments and insurers to cover the cost of the drugs. These developments have dramatically changed the outlook for obesity, with the US recording its first fall in obesity rates since at least the 1970s, a dramatic turnaround from predictions of just a few years ago.
Source: CDC, OECD, WHO, IHME, Harvard
The development also has some significant investment implications. Most obvious are the potential investment opportunities in the drug manufacturers, although given high expectations we need to carefully monitor scientific developments and the pricing environment. There are also several investment risks to consider, with the potential for lower demand for certain medical device companies, food manufacturers and quick service restaurants.
The unrelenting rise in sovereign debt
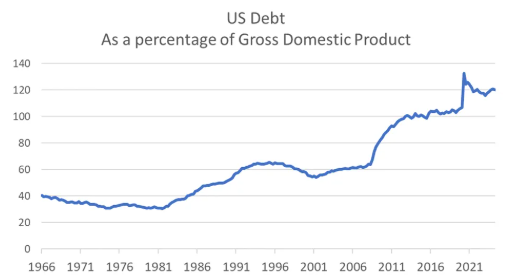
Not all megatrends are positive for investors; one megatrend to be wary of is rising sovereign debt. In many parts of the world fiscal responsibility is no longer a priority as governments focus on more immediate issues and winning elections. In the US the national debt has been rising since the 1980s. In 2010, following the government’s response to the Global Financial Crisis, it first exceeded 90% as a percentage of GDP – the level identified by academics Reinhart and Rogoff as associated with a worsening in growth outcomes. A further spending binge during the 2020 COVID pandemic has resulted in the US national debt rising to more than 120% of GDP.
Source: Federal Reserve Economic Data
With the US Federal budget deficit expected to hit $1.8 trillion in 2024 and both parties promising billions more in spending, debt is likely to continue to build. US national debt has not been a major issue for markets to date, but the risk of a debt crisis, accompanied by rising bond yields and volatile markets, increases as debt levels continue to rise. Many other countries are in a similar position, with debt to GDP exceeding 100% in the UK, France, Spain, Italy and Japan. Australia is relatively well placed with the national debt at 38% of GDP.
What does this mean for investors? Governments have three ways to “solve” excessive national debt: (1) austerity – cutting spending and raising taxes; (2) default; or (3) financial repression – printing money to inflate the problem away. The first is politically unpalatable and appears unlikely, the second would be an outright disaster and can be avoided by countries that issue debt in their own currency such as the US. Thus, the most likely outcome is money printing, or central bank financing of budget deficits in more technical terms, resulting in a period of structurally higher inflation.
While it’s impossible to be precise in terms of the timing of a potential debt crisis, investors can seek to protect themselves by investing in real assets, such as property and equities, with a focus on high quality companies with pricing power that can protect investors in times of high inflation.
These are just a few of the megatrends shaping markets today and in the future. As investors, a long-term focus and active management are key to both taking advantage of the opportunities these trends provide and avoiding risks that may arise.
Source: Magellan
Nine bad habits of ineffective investors: common mistakes investors make
By Robert Wright /November 20,2024/

Introduction
In the confusing and often seemingly illogical world of investing, investors often make various mistakes that keep them from reaching their financial goals. This note takes a look at the nine most common mistakes.
Mistake #1 Crowd support indicates a sure thing
“I will tell you how to become rich…Be fearful when others are greedy. Be greedy when others are fearful”. Warren Buffett, Investor and CEO
It’s normal to feel safer investing in an asset when your friends and neighbours are doing the same and media commentary is reinforcing the message that it’s the place to be. But “safety in numbers” is often doomed to failure. The trouble is that when everyone is bullish and has bought into an investment with general euphoria about it, it gets to a point where there is no one left to buy in the face of more positive supporting news but instead there are lots of people who can sell if the news turns sour. Of course, the opposite applies when everyone is pessimistic and bearish and have sold – it only takes a bit of good news to turn the value of the asset back up. So, the point of maximum opportunity is when the crowd is pessimistic (or fearful) and the point of maximum risk is when the crowd is euphoric (and greedy).
Mistake #2 Current returns are a guide to the future
“Past performance is not a reliable indicator of future performance”. Standard disclaimer
Faced with lots of information, investors often use simplifying assumptions, or rules, in order to process it. A common one of these is that “recent returns or the current state of the economy and investment markets are a guide to the future”. So tough economic conditions and recent poor returns are expected to continue and vice versa for good returns and good economic conditions. The problem with this is that when it’s combined with the “safety in numbers” mistake, it results in investors getting in at the wrong time (e.g. after an asset has already had strong gains) or getting out at the wrong time (e.g. when it is bottoming). In other words, buying high and selling low.
This is pertinent now with shares providing strong gains over the last two years – with US shares up 56%, global shares up 49% and Australian shares up 25% – despite lots of worries about interest rates, recession, commercial property and US banks, wars, elections, etc. This has brought with it a temptation to conclude we are in a “new era” where macro problems don’t matter and that even if they do central banks will protect us by slashing rates and pumping money in (the so-called “central bank put” which morphed from the “Greenspan put” many years ago) and governments will do the same with government spending.
Unfortunately, we have heard the “this time is different” argument many times before only to find out that it’s not – usually when we are most complacent! The reality is that shares have done well over the last two years because they came off a big cyclical fall in 2022 and the threats have not proved that serious economically. For instance, the much feared recession has failed to appear and the war in the Middle East has not disrupted global oil supplies (so far). And the “central bank put” did not prevent the tech wreck and the GFC (both saw US shares fall around 50%) and various other share market plunges. Just because shares have had strong returns over the last two years, despite lots of worries, doesn’t mean that the cycle has been abolished and that there is nothing at all to worry about.
Mistake #3 “Experts” will tell you what will happen
“Economists put decimal points in their forecasts to show that they have a sense of humour”. William Gillmore Simms, Novelist and Politician
The reality is that no one has a perfect crystal ball. It’s well known that forecasts as to where the share market, property market and currencies will be at a particular time have a dismal track record, so they need to be treated with care. Usually the grander the forecast, calls for “new eras of permanent prosperity” or for “great crashes ahead”, the greater the need for scepticism as either they get the timing wrong or it’s dead wrong.
Market prognosticators suffer from the same psychological biases as everyone else. And sometimes forecasts themselves can set in motion policy changes that make sure they don’t happen – such as rate cuts heading off sharp house price falls in the pandemic in 2020. The key value of investment experts is to provide an understanding of the issues around an investment and to put things in context. This can provide valuable information in terms of understanding the potential for an investment. But if forecasting was so easy, the forecasters would be rich and so would have retired!
Mistake #4 Shares can’t go up in a recession…
“It’s so good it’s bad, it’s so bad it’s good”. Anon
A common lament around in second half 2020, after share markets rebounded from their late March 2020 pandemic low, was that, “the share market is crazy as the economy is in deep recession and earnings are collapsing!” Of course, shares kept rising into 2022, economies recovered, and earnings rebounded. The reality is that share markets are forward looking, so when economic data and profits are really weak, the market has already factored it in.
History tells us that the best gains in stocks are usually made when the economic news is still poor, as stocks rebound from being undervalued and unloved, helped by falling interest rates. In other words, things are so bad they are actually good for investors! Of course, the opposite applies at market tops after a sustained economic recovery has left the economy overheated with no spare capacity and rising inflation and so the share market frets about rising rates. Hence things are so good they become bad! This seemingly perverse logic often trips up many investors.
Mistake #5 Letting a strongly held view get in the way
“The aim is to make money, not to be right”. Ned Davis, Investment Analyst
Many let their blind faith in a strongly held, often bearish view – “there is too much debt”, “aging populations will destroy returns”, “a house price crash is imminent”, “a Trump victory will see shares crash”, etc. – drive their investment decisions. This is easy to do as the human brain is wired to focus on the downside more than the upside, so we are easily attracted to doomsayers. They could be right one day but lose a lot of money in the interim. Giving too much attention to pessimists doesn’t pay for investors.
Mistake #6 Looking at your investments too much
“Investing should be like watching paint dry or watching grass grow. If you want excitement…go to Las Vegas”. Paul Samuelson, Economist
Checking up on how your investments are doing is a good thing, surely? But the danger is that the more investors are exposed to news around their investments, the more they may see them falling. Whereas share markets have historically generated positive returns more than 60% of the time on a monthly basis and more than 70% of the time on a calendar year basis, day to day it’s close to 50/50 as to whether the share market will be up or down.

Daily & monthly data from 1995, data for years and decades from 1900. Source: Bloomberg, AMP
Being exposed to this very short term “noise” and the chatter around it can cause investors to have a greater exposure to lower returning but safer investments that won’t grow wealth. The trick is to turn down the noise and have patience. Evidence shows that patient people make better investors because they can look beyond short-term noise and are less inclined to jump into one investment after another after they have already had their run.
Mistake #7 Making investing too complex
“There seems to be a perverse human characteristic that makes easy things difficult”. Warren Buffett
With the increasing ease of access to investment options, ways to put them together and information and processes to assess them, investing is getting more complex. But when you overcomplicate your investments, it can mean that you can’t see the wood for the trees. You can spend so much time focusing on this stock or ETF versus that stock or ETF or this fund manager versus that fund manager, that you ignore the key driver of your portfolio’s risk and return which is how much you have in shares, bonds, real assets, cash, onshore versus offshore, etc. Or that you end up in things you don’t understand. Instead, it’s best to avoid the clutter, don’t fret the small stuff, keep it simple and don’t invest in things you don’t understand.
Mistake #8 Too conservative early in life
“Compound interest is the eighth wonder of the world. He who understands it, earns it, he who doesn’t, pays it”. Albert Einstein, Theoretical Physicist
Cash and bank deposits are low risk and fine for near term spending requirements and emergency funds, but they won’t build wealth over time. The following chart shows the value of $1 invested in various Australian assets since 1900 allowing for the reinvestment of interest and dividends along the way. That $1 would have grown to $955,656 if invested in shares but only to $263 if invested in cash. Despite periodic setbacks, shown with arrows (such as WWI, the Great Depression, WWII, stagflation in the 1970s, the 1987 share crash and the GFC), shares and other growth assets grow to much higher values over time thanks to their higher returns over the long term than cash and bonds and thanks to the magic of compound interest where higher returns build on higher returns through time.

Source: ASX. Bloomberg, RBA, AMP
Not having enough in growth assets early in their career can be a problem for investors as it can make it harder to adequately fund retirement later in life as they miss out on the magic of compounding higher returns on higher returns through time in growth assets like shares and property. Fortunately, compulsory superannuation in Australia helps manage this, although early super withdrawal for various purposes (through the pandemic, for medical needs and as proposed for housing) may set this back for some. For example, a 30 year old who withdraws $20,000 from their super could have around $184,000 (or $74,000 in today’s dollars) less when they retire at age 67 based on assumptions in the ASIC MoneySmart Super Calculator.
Mistake #9 Trying to time the market
“Far more money has been lost by investors in preparing for corrections, or anticipating corrections, than has been lost in the corrections themselves”. Peter Lynch, Fund Manager
In the absence of a tried and tested process, trying to time the market, i.e. selling before falls and buying ahead of gains is very difficult. Many of the mistakes referred to above kick in and it can be a sure way to destroy wealth. Perhaps the best example of this is a comparison of returns if the investor is fully invested in shares versus missing out on the best days. Of course, if you can avoid the worst days during a given period you will boost your returns. But this is very hard and many investors only get out after the bad returns occur, just in time to miss out on some of the best days and so hurt their returns. If you were fully invested in Australian shares from January 1995, you would have returned 9.5% p.a. (including dividends but not allowing for franking credits). But if by trying to time the market you miss the 10 best days the return falls to 7.5% p.a. If you miss the 40 best days, it drops to just 3.5% p.a. Hence, it’s time in the market that’s the key, not timing the market. The last two years provide a classic example of how hard it is to time markets – there has been a long worry list, so it’s been easy to be gloomy but timing markets on the back of this has been a loser as shares put in strong gains.
Concluding comment
I know it sounds kind of boring and like a cliché, but the easiest way to overcome many of these mistakes is to have a long-term investment plan that allows for your goals and risk tolerance and then stick to it.
Source: AMP