
Tag Archives: Money
Federal Election 2025
By Robert Wright /May 23,2025/

During the Federal Election campaign, the Government made a number of election promises, which may impact your finances. There were also a number of support measures proposed in the recent Federal Budget. What could this mean for you?
These announcements are proposals only and may or may not be made law. The information below, including the policy details and proposed start dates, is based on the information announced as at 5 May 2025. You should speak to your financial adviser to discuss how these proposals could apply to you.
Election promises
Taxation
$1,000 instant tax deduction for work-related expenses, proposed from 1 July 2026.
What’s proposed?
Taxpayers who have eligible work-related expenses may be able to claim a tax deduction of up to $1,000 without having to keep individual receipts. It will still be possible to claim work-related expenses above this limit, however evidence will be needed.
Who could benefit?
The deduction will be available to people with ‘labour income’. This doesn’t include income from running a business or from investments, where the usual rules will continue to apply.
$20,000 small business instant asset write-off extension, proposed from: 1 July 2025 to 30 June 2026.
What’s proposed?
The higher instant asset write-off threshold of $20,000, which currently applies until 30 June 2025, is proposed to be extended for another 12 months until 30 June 2026. The threshold is available for more than one asset. Eligible businesses can continue to place assets valued at $20,000 or more into a depreciation pool, where a deduction of 15% can be claimed in the first income year and 30% thereafter.
Who could benefit?
Small businesses with an aggregated annual turnover below $10 million will be able to claim an immediate tax deduction for the full cost of eligible assets costing less than $20,000 that are first used or installed ready for use by 30 June 2026.
Help for home buyers
Expanded ‘Help to Buy’ scheme, proposed from: to be confirmed.
What’s proposed?
The Government has proposed to expand access to the Help to Buy scheme to more home buyers by increasing the property price caps and income test thresholds, which determine eligibility to participate in the scheme.
The scheme is a shared equity scheme, which allows eligible home buyers to purchase a home with a smaller deposit, of as little as 2%. The Commonwealth will contribute up to 30% of the purchase price of an existing home and up to 40% of the purchase price of a new home.
The Help to Buy scheme is expected to open for applications later this year. Although the Federal Government has legislated the scheme, the States and Territories need to pass legislation for it to operate in each jurisdiction.
Who could benefit?
Increasing the income cap and property price caps will enable more people to participate in the scheme.
For singles, the income cap will increase from $90,000 to $100,000. For joint applicants (and single parents), the income cap will increase from $120,000 to $160,000.
The property price cap will depend on the location of the property and details can be found in the Government’s media release.
Participants must meet a number of eligibility rules and conditions, including repaying the Government when the home is sold or when certain changes occur in their circumstances. So it’s very important to understand the rights and responsibilities of participating in the scheme before making an application.
Previously announced measures
Cost of living support
The below proposals were announced by the Government in the March 2025 Federal Budget.
Energy bill relief extended for six months, proposed from: July 2025.
What’s proposed?
The Government will provide further energy rebates in addition to the bill credits people have received since July 2024. The rebate will be applied automatically to electricity bills between 1 July and 31 December 2025, in two quarterly instalments of $75.
Who could benefit?
All Australian households and eligible small businesses will receive the additional energy rebate. It’s expected the eligibility rules that apply to small businesses (quarterly power consumption) will not change.
Lower cap for PBS medicines, proposed from: January 2026.
What’s proposed?
The maximum cost of Pharmaceutical Benefits Scheme (PBS) medicines will decrease from $31.60 to $25 per script.
Who could benefit?
This will benefit people who don’t hold a concession card and would otherwise pay the maximum amount to fill a script. It doesn’t apply if the script is for a medicine not on the PBS, which may cost more than $25. Pensioners and Commonwealth concession cardholders will continue to pay the subsidised rate of $7.70 per PBS script until 1 January 2030. This is an existing measure.
Student loans to be cut by 20%, proposed from: 1 June 2025.
What’s proposed?
Student loans will be reduced by 20% before the annual indexation (at a rate of 3.2%) is applied on 1 June 2025.
Who could benefit?
The changes will benefit all people who have Higher Education Loan Program (HELP) Student Loans, VET Student Loans, Australian Apprenticeship Support Loans, Student Start-up Loans and Student Financial Supplement Scheme, based on their outstanding 1 June 2025 balance.
Importantly, voluntary loan repayments that are processed before 1 June will reduce the loan balance that’s indexed on 1 June. However, the 20% debt reduction will be applied to the 1 June balance. So if this proposal is legislated, before making a voluntary repayment, it’s worth doing the numbers to see if it’s best to make a voluntary repayment before or after the 20% reduction and indexation is applied on 1 June. The table below provides an example which shows the difference between making a $5,000 voluntary repayment before and after 1 June, where the outstanding debt balance is $30,000.
| Outstanding debt today | Voluntary repayment before 1 June | Loan balance on 1 June (after 20% reduction and indexation applied)
|
Voluntary repayment after 1 June | Outstanding balance |
| $30,000 | $0 | $24,768 | $5,000 | $19,768 |
| $30,000 | $5,000 | $20,640 | $0 | $20,640 |
Reduced student loan repayment obligations, proposed from: 1 July 2025.
What’s proposed?
The minimum income that can be earned before student loan repayments need to be made is proposed to increase. This is in addition to the standard indexation of the income repayment thresholds which ordinarily happens on 1 July each year. Also, the way repayments are calculated will be changed.
Who could benefit?
People with student debts will benefit from lower compulsory loan repayments in 2025/26 and beyond, if their ‘repayment income’ is above the minimum threshold at which loan repayments need to be made and less than $180,000.
The minimum income threshold is $54,435 in 2024/25 and will automatically increase to $56,156 on 1 July. Also, the Government has proposed:
- increasing the minimum income threshold to $67,000; and
- calculating repayments on just the repayment income earned above the income threshold, not on total income.
The list of qualifying student loans is the same as those to be eligible for the 20% debt reduction on 1 June 2025 (see above).
Expanded ‘First Home Guarantee’ program, proposed from: to be confirmed.
What’s proposed?
Help will be extended to all first home buyers under the Commonwealth’s First Home Guarantee Scheme. The scheme enables home buyers to purchase their first home with as little as a 5% deposit. The Government provides a guarantee for the remaining portion of the deposit (up to 15%), to ensure the first home buyer doesn’t pay Lenders Mortgage Insurance.
Currently, income limits and property price caps apply and access is only granted to a maximum of 10,000 eligible participants each year. These requirements are proposed to be removed, opening the scheme to all first home buyers.
Who could benefit?
The extension of the scheme may help first home buyers to purchase their first home sooner. It’s important to understand that purchasing a home with a smaller deposit may increase the total interest that is paid over the life of the loan.
Superannuation
The below measure was initially announced by the Government in 2023, with support reconfirmed in the 2023 Federal Budget. Legislation was introduced to Parliament to make this change law in 2024 but lapsed when the election was called. The Government will need to reintroduce and pass legislation in Parliament before this change can take effect. Given the complexity of the policy and the number of days that Parliament may sit between now and 1 July, we don’t know if the proposed start date will change if the policy is reintroduced.
Higher taxes for balances over $3 million, proposed from: 1 July 2025.
What’s proposed?
Where people have more than $3 million in super (both accumulation and retirement values) from 1 July 2026, higher taxes are to be paid on investment earnings, with payment due in the 2027 financial year.
Currently, investment earnings within the ‘accumulation phase’ of superannuation are taxed at a maximum rate of 15%. With a ‘retirement phase income stream’, such as an account-based pension once retired, investment earnings are generally tax free.
It’s proposed that from 1 July 2025, where a person has a ‘total super balance’ exceeding $3 million at the end of the financial year, an additional tax of 15% will apply to a portion of the investment earnings. The new tax will be called ‘Division 296 tax’, as that is the name of the relevant section of tax law where the proposed rules are covered.
Additional tax won’t be paid where the total super balance is less than $3 million on 30 June 2026 (the end of the first year it will apply) or the end of any following financial year.
Where to from here?
It’s important to remember these changes need to be legislated to become law. The information above is based on the announcements made to date, and there may be changes to the start dates or other details if the policies are formalised. You should speak to a financial adviser to understand more about what has been announced and how these changes could apply to you.
Source: MLC
The absurdity and calamity of US tariff policies
By Robert Wright /May 23,2025/

US tariffs are poorly designed, badly implemented and are already damaging both the US and global economies. The economic damage will only get worse as uncertainty further undermines business and consumer confidence and results in dislocation of global supply chains.
Determining the extent of economic damage, and financial market implications, is difficult because we don’t know what tariffs will actually be implemented or how many backflips there are before then. There’s no clear, defining strategy. The justification for tariffs oscillates between reinvigorating US manufacturing, raising revenue to fund tax cuts, the cost of the US providing global security, the provision of the US dollar to support global trade and financial markets, and broadly addressing an ‘unfair’ trading system. Different justifications would lead to different structures of the tariff regime. Adding to uncertainty, key individuals in the administration have different goals for tariffs.
- The obsession with bilateral trade deficits is baseless
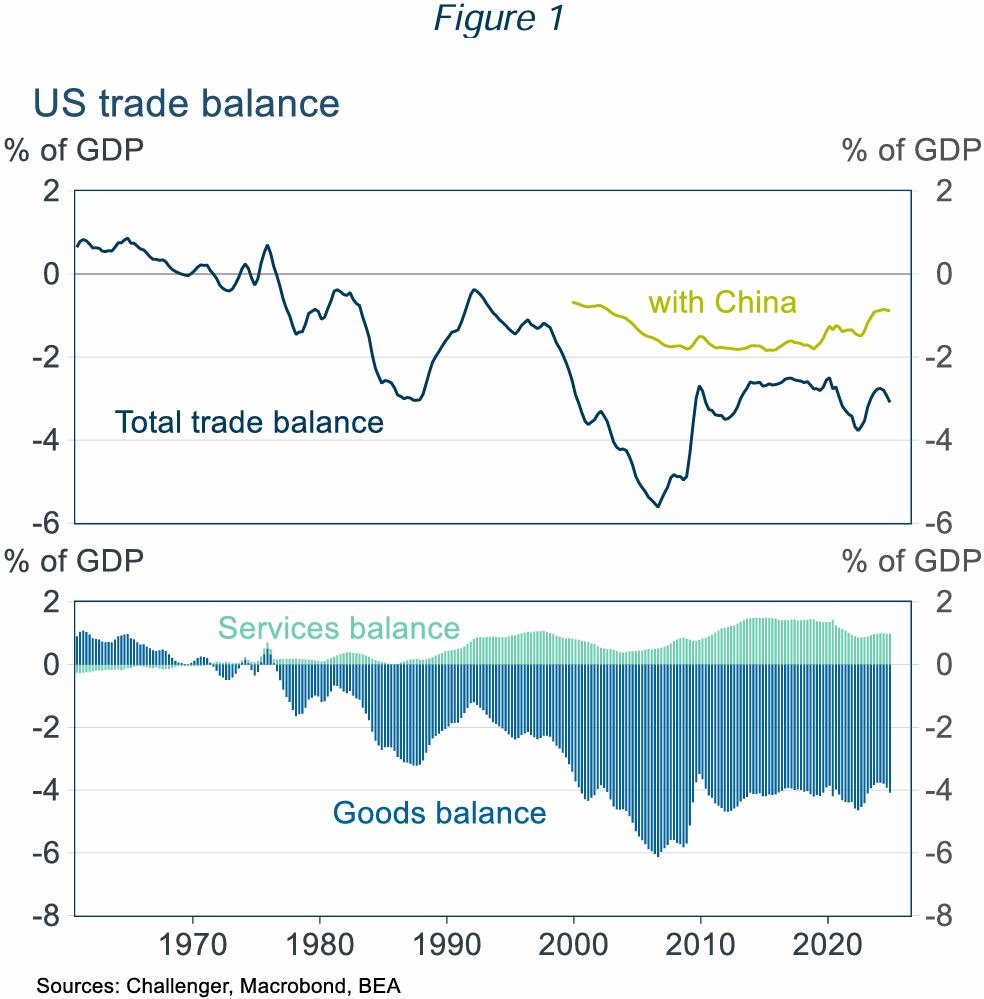
President Trump’s tariff obsession is rooted in a dislike of trade deficits. The United States has run a trade deficit since the mid-1970s (Figure 1). He attributes this deficit to unfair trade policies in other countries and an overvalued US dollar, resulting from US dollar demand given its role in international trade and finance. But the trade deficit also depends on US domestic conditions, notably the US Government’s huge fiscal deficit, currently 5% of GDP.
Balanced national trade doesn’t need bilateral balanced trade
Even if balanced trade at the country level was desirable, there is no reason for this to apply country by country. Even countries with balanced aggregate trade run large trade deficits or surpluses with almost all of their trading partners: Belgium had balanced trade with just two countries; and Canada, Finland, South Korea and South Africa each had balanced trade with just one of their trading partners. Each of these five countries had significant bilateral trade surpluses or deficits with over 150 of their trading partners. The US goal of balanced bilateral trade with every country is, frankly, bonkers.
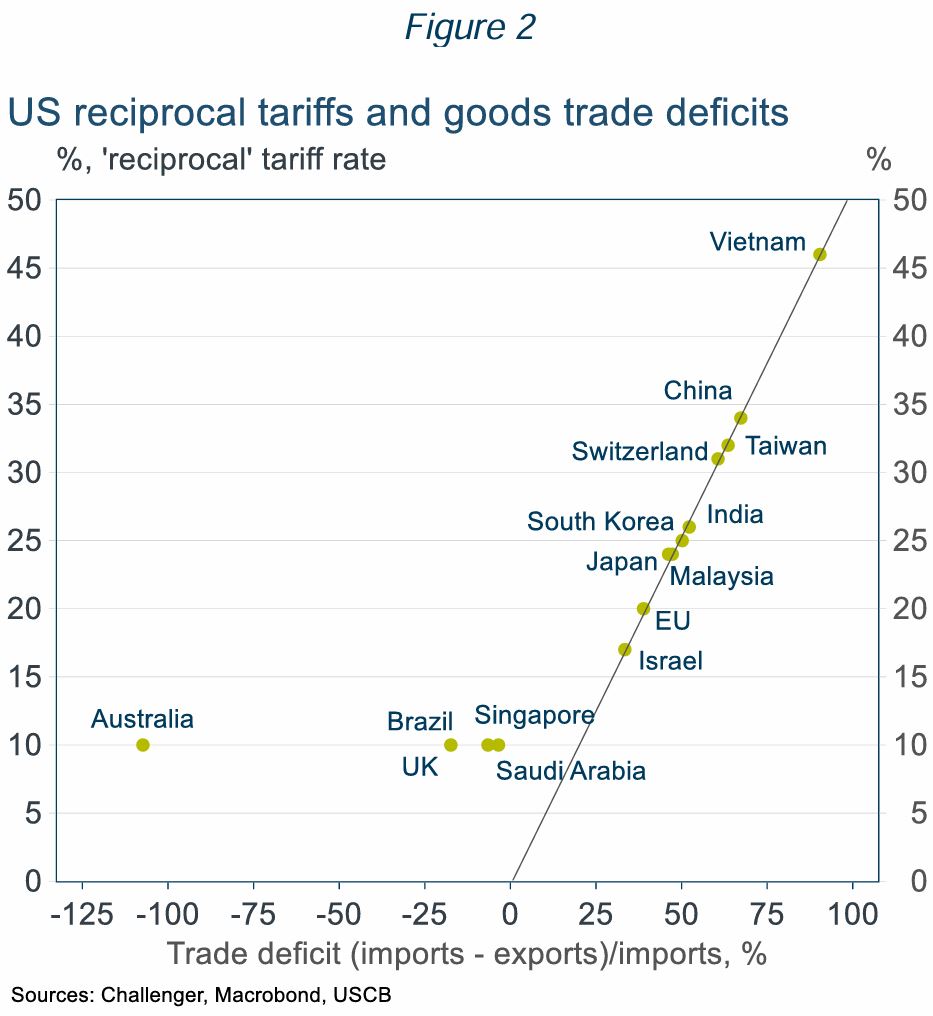
- The calculation of tariff rates is absurd
- Bilateral trade balances are meaningless but determine the US ‘reciprocal tariffs’ (Figure 2).
- Even countries the US has a trade surplus with, including Australia get a 10% tariff. If Australia applied the same logic as the US, we’d impose a tariff on the US of around 50%.
- The US has a surplus in services trade of 0.25% of GDP (partly offsetting the goods trade deficit of 1% of GDP; Figure 1) but ignores services trade in its calculation of tariffs.
- The tariffs are badly designed reflecting unclear and inconsistent goals
The US tariff regime has a mix of tariffs on specific goods (steel, aluminium, vehicles) and on specific countries (Canada, Mexico, China and the reciprocal tariffs) reflecting the varied goals of the tariffs. But many of these goals are in conflict. If, as Trump claims, tariffs raise revenue without increasing US prices by forcing foreign suppliers to absorb the tariff, then US manufacturers won’t be more competitive as US prices won’t be higher. And if tariffs are successful in boosting US production, then there would be fewer imports, and so less tariff revenue.
Several bad design elements of the tariffs mean there will be further changes:
- Different tariff rates distort trade for little benefit – for example, Apple intends to ship iPhones to the US from India rather than China as US produced iPhones would be prohibitively expensive.
- High tariffs are being applied to goods the US can’t, or won’t, ever produce – for example, some minerals and shoes (most come from China and Vietnam with 145% and 46% tariffs).
- Tariffs are being applied to inputs used by US manufacturers, increasing exporters’ costs.
- The effective trade embargo with China will be disruptive to the US economy
The 145% punitive tariff applied to China makes most imports from China prohibitively expensive. But the US economy is not ready to disengage from China, which has supplied 13% of US imports. Factories don’t pop up overnight.
Using a fine disaggregation, breaking down goods into their constituent parts, over half of US imports are from China. Alternative suppliers just don’t exist.
For finished consumer goods with very high import shares from China, large price increases and stock shortages will be disruptive to consumers and impact consumer sentiment and support for tariffs. The economic impact will be even greater for those imports predominantly sourced from China that are used as inputs in US production, such as explosives, machinery and various chemicals. For example, China is also a key source for base ingredients used in manufacturing medicines and finished medicines.
- The tariff regime won’t survive its poor design, but tariffs won’t go away completely
The US tariff regime is already unravelling with holes poked in the tariff wall.
- Reciprocal tariffs were paused until 9 July (the baseline 10% tariff still applies to all countries).
- Consumer frustration will mount facing higher prices and product shortages. For example, phones, computers and some other electronics have been exempted from the China tariffs.
- Businesses are getting traction lobbying on the cost to production from tariffs, for example there will be a partial rebate on the 25% tariffs on car parts used as inputs in US manufacturing.
- The US has said some 70 countries want to negotiate tariff reductions. Yet negotiating a detailed trade agreement takes time. The renegotiation of the US-Canada-Mexico trade agreement in President Trump’s first term took 18 months. A rushed negotiation will contain flaws.
However, President Trump strongly believes in the benefits of tariffs for promoting US manufacturing and he needs the revenue. He has committed to using tariffs to reduce income taxes, even musing that income taxes could be eradicated. But a 10% uniform tariff has been estimated to raise just $1.7 trillion over 10 years, a 20% tariff $2.6 trillion. This is substantially less than the estimated cost of $5 to 11 trillion of the tax cuts already promised by President Trump.
- What does the future hold?
There will be many more turns in the road with backflips, reduced tariffs for goods the US won’t produce or needs and new tariffs. There will be ‘deals’ reducing (but not eliminating) individual tariffs with countries committing to reduce trade barriers and import US goods (much of which will never happen).
The pause in reciprocal tariffs, after just one week, was reportedly triggered by the turmoil in bond markets which could have precipitated a financial crisis. Trump has displayed greater resolve in the face of the large fall in equity prices than in his first term. But the risk of a financial crisis, or severe recession, and sharp falls in approval ratings are likely to remain red lines that would result in some pullback.
Challenger expects ongoing tariff uncertainty and hence further volatility in markets. Aggregate tariffs will never get to the levels initially announced, but they will also be much higher than before, reducing US and global growth. Tariffs will add to US inflation, reducing the ability of the Fed to ease. Market pricing is for almost 100 basis points of cuts this year, but there’s a good chance the Fed does not even cut this year.
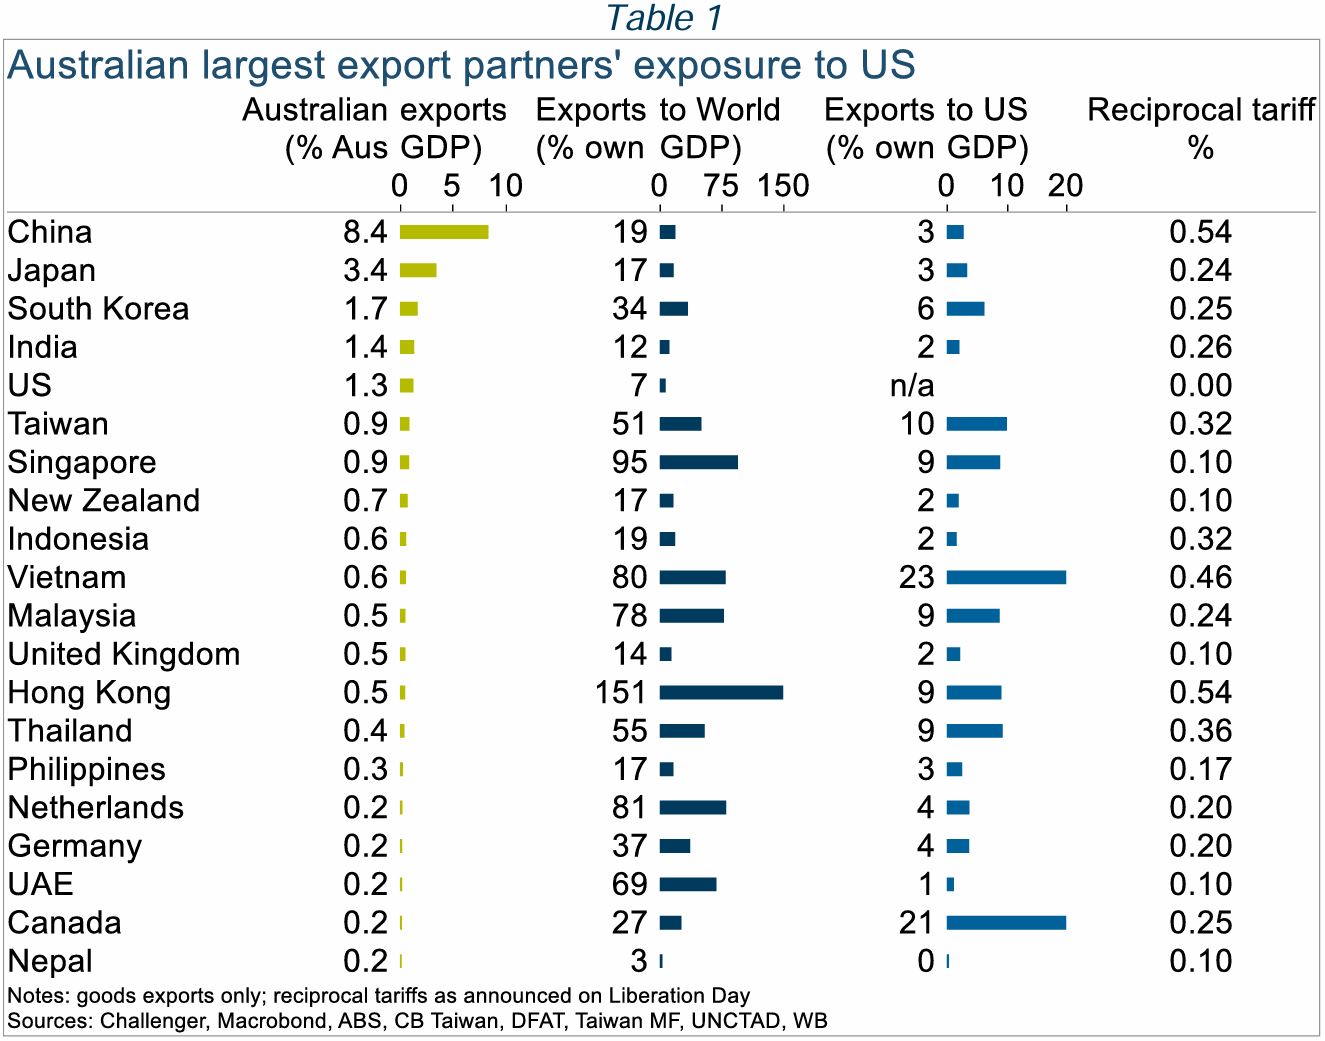
Australia will also see slower growth. We have limited direct exposure to the US economy, but our largest trading partners are more exposed (Table 1). The IMF downgraded its GDP growth forecasts for 2025 by 0.5%. Slower growth, and China’s surplus manufacturing capacity reducing Australian import prices, will lower inflation opening the path to RBA rate cuts. However, market pricing for a cash rate below 3% by December is overdone. With the worst case for US tariffs unlikely to play out, three cuts bringing the cash rate to 3.35%, around its neutral level, seems more likely.
Source: Challenger
What tax deductions can I claim working from home?
By Robert Wright /July 20,2020/

According to the Australian Taxation Office, there are three ways to claim your home office running expenses.
The actual cost method
Under this method, your tax deductions include the actual costs of work-related expenses. This applies to things such as the costs of your home office furniture and fittings, as well as equipment such as computers and desks.
If the cost of depreciable home office items is less than $300 you may claim the full cost of these items as a tax deduction. If the cost of depreciable home office items is over $300, you may claim a deduction for the depreciation of these items.
If you regularly phone your employer or clients while you are away from your usual place of work, you can also claim a full tax deduction for the work-related portion of the phone calls you make at home and the cost of renting your phone.
Other costs you can claim a deduction for under the actual cost method include:
- Internet access charges.
- Printer and printer cartridges.
- The cost of heating, cooling and lighting your home office, over and above the amount you would ordinarily pay if you did not work from home.
- Any repairs to your home office furniture and fittings.
As your home isn’t considered to be a place of business, you can’t claim non work-related expenses under this method. This includes rent, the interest you pay on your mortgage and the cost of any insurance premiums.
The fixed cost method
Under this method, instead of tax deductions relating to the work portion of costs incurred at home, you can claim a rate of 52 cents per hour for expenses such as heating, lighting and cooling, come tax time. You can also apply the same rate when claiming a depreciation of home expenses, for example any furniture you’re now using in your home office.
The shortcut method
At the moment a special method, known as the shortcut method, is available to people working from home to claim work-related expenses as tax deductions. Please note however, that the special rate is only available from 1 March 2020 to 30 June 2020.
Under this method, each person in a household can claim expenses based on a rate of 80 cents an hour. So more than one person in a household – flatmates or members of the same family – can each claim a deduction for their expenses incurred that directly related to working from home. All that’s required to do so, is keeping a log of the hours you work.
The 80 cents per hour shortcut method seems like an easy way to work out your home office expenses come tax time. However, the risk for people using this method is that they won’t claim as much as they are entitled to under the other two methods. You also can’t claim the cost of equipment such as webcams and office furniture, as well as stationery or computer consumables like printer cartridges.
Whichever method you choose, it’s a good idea to keep accurate records of all your actual expenses, plus the hours you have worked. That will allow you to choose the best method when you or your tax agent prepares your tax return.
Source: BT
Economic Update
By visual /May 13,2020/

Market and Economic overview
Australia
The coronavirus ‘curve’ of known cases has flattened out, suggesting social distancing measures have been successful in slowing the spread of the disease.
The focus is now on a gradual easing of restrictions – people will gradually start returning to work as non-essential areas of the economy start to function again.
It will take time for conditions to normalise completely – borders remain closed to overseas visitors, for example, so tourism-related areas of the economy will continue to struggle.
It remains too early to say how significant the slowdown will be, but some observers have suggested the Australian economy could contract by approximately 5% in 2020. At the same time, consensus expectations suggest unemployment could double, from around 5% in February to perhaps 10% during the course of this year.
Job security is low and house prices appear likely to fall, which could further dampen sentiment. For now, credit card spending is running nearly -20% below the corresponding period a year ago, highlighting the current weakness in consumer confidence.
United States
By the end of April, more than 1 million people in the USA had been diagnosed with coronavirus.
Like other countries, the US had implemented various closures and restrictions. The ‘30 Days to Slow the Spread’ expired on 1 May 2020 and President Trump has suggested social distancing restrictions will not be extended.
Trump appears determined to reopen the economy as soon as possible, against the recommendations of some medical professionals. Ultimately, he wants the economy firing again in the run-up to the Presidential election in November.
The latest data showed the world’s largest economy shrank at an annual rate of -4.8% in the March quarter, even worse than consensus forecasts.
The downturn was due to economic disruptions in March. Data for the June quarter is expected to be worse still given more extensive closures during April, at least.
Europe
Much of Europe remains in lockdown, although numbers of cases vary quite markedly across the region. Germany – the largest economy in Europe – has much fewer cases than some other countries such as France, Italy, Spain and the UK. The economic impact might therefore differ between countries but will undoubtedly be significant overall.
Euro Area GDP growth declined at an annual rate of -3.3% in the March quarter and is expected to fall further in the June quarter.
Annual growth rates were lower still in some of the region’s major economies: France -5.4%; Italy -4.8%; and Spain -4.1%.
New Zealand
Restrictions have been eased in New Zealand; ‘Level 3’ measures are now in place – similar to those in Australia – after the more stringent ‘Level 4’ lockdown was no longer deemed necessary.
The Reserve Bank of New Zealand remains very active with its recently introduced asset purchase program. The Bank is buying large amounts of government and local authority bonds to ensure the smooth operation of the local fixed income market.
Asia
China’s economy shrank at an annual rate of -6.8% in the March quarter; a sharp slowdown from the 6.0% year-on-year growth seen in the December quarter of 2019.
The industrial sector was hardest hit by the near two-month shutdown of non-essential parts of the economy.
Whilst alarming, the short-term contraction will not impede China’s long-term growth trajectory, according to officials. That said, conditions could remain subdued in the foreseeable future.
Australian dollar
The Australian dollar clawed back all of its lost ground from March. The currency gained 7.0% against the US dollar, closing April at 65.5 US cents. Similar strength was seen against other currencies too.
Commodities
Most commodity prices finished the month of April stronger as demand uncertainty eased. Following sharp falls in March, copper (8.0%), nickel (8.0%) and zinc (3.4%) posted solid gains, although not enough to recover previous losses.
Iron ore (1.4%) reversed its downward trend on signs of a turnaround in Chinese manufacturing activity and reflecting China’s economic stimulus plans.
Oil prices (WTI Crude -26.6%) continued to fall, although stemmed losses towards month end on evidence of falling production.
The gold price (7.6%) again proved resilient against a backdrop of ongoing market uncertainty, while platinum (9.8%) and silver (10.1%) bounced back after March’s sharp falls.
Australian equities
The equity market recovery in the last week of March continued throughout April. The S&P/ASX 100 Accumulation Index rose 8.4%, registering its strongest monthly return since 1988.
Confidence was initially supported by the huge monetary and fiscal responses to the pandemic and later by encouragement that social distancing restrictions were proving effective.
The full impact of the virus remains unknown, however, and the shock to company earnings and balance sheets has placed additional pressure on dividend policies. At the same time, most companies have withdrawn earnings guidance.
Australia’s banks continued to underperform, as delays to mortgage payments and decreased property activity threaten earnings. The growing prospect of dividend cuts and the view that the banks will play a key role in supporting the economy has further dragged on investor sentiment.
Listed property
After plunging dramatically in March, global listed property markets rebounded in April. The COVID-19 situation continues to be the dominant driver of property securities. Due to virus containment measures globally, including widespread lockdowns, there are rising expectations for sweeping rent abatements across the sector, particularly in the most heavily hit sub-sectors such as discretionary retail. Many listed property securities globally have now withdrawn their earnings and dividend guidance due to the uncertainty.
Global equities
Unprecedented levels of monetary and fiscal support helped global markets stage a remarkable recovery. The MSCI World Index bounced 10.6% in local currency returns in April – its strongest month since 1975. The appreciation of the Australian currency tempered global equity returns for domestic investors, with the MSCI World Index rising ‘only’ 3.7% in Australian dollar terms.
UK equities were the weakest performers in April, with oil giant Shell announcing a cut in its dividend. Financial stocks also weakened after Lloyds revealed a large drop in profits. Disappointing returns from energy and financials stocks have contributed to the underperformance of the MSCI World Value Index in recent months.
Global and Australian Fixed Income
Bond markets were substantially calmer in April compared to March as central bank support programs appeared to be having their desired effect.
The Reserve Bank of Australia, for example, has bought around $50 billion of government and state government bonds in the past few weeks. This has materially improved liquidity and helped steady the local bond market.
Benchmark 10-year US Treasury yields closed April just 0.03 percentage points lower, at 0.64%. Yields also declined in the UK, Germany and Japan, by 13 bps, 12 bps and 5 bps, respectively.
Australian yields moved in the opposite direction, though not significantly. The yield on 10-year Commonwealth Government bonds closed the month 13 bps higher, at 0.89%. This resulted in a modest negative return from the domestic bond market.
Global credit
Like shares, corporate bonds were buoyed by an improvement in risk appetite globally. Credit spreads – the difference in yield between corporate bonds and comparable high-quality government bonds – narrowed substantially.
Companies looked to take advantage of improving risk appetite and strong inflows into the asset class by offering a substantial amount of new bonds. In some cases, this was to bolster their balance sheets to help cushion the impact of a more prolonged period of lower profitability.
Source: Colonial First State