
Tag Archives: Financial Planning
Super fund performance and unlisted assets
By Robert Wright /December 01,2023/

Differences in the returns of various super funds have primarily been driven by whether the funds are invested in unlisted or listed assets.
Super fund returns are always in the spotlight around the end of the financial year. This is when funds publish their annual performance results and send statements to members, and when researchers publish tables comparing fund returns.
Going forward, fund members may notice a wider than usual gap between the performances of various super funds.
A large part of the difference in returns this year comes down to whether – and how much – super funds have invested in unlisted assets.
In recent years, super funds have been under pressure due to their practices around “lumpy” revaluations for unlisted assets concerning the quality, accuracy and frequency of revaluing unlisted assets.
Millions of super members are in the dark about these practices – and therefore about how much their investment is really worth.
In July 2022, the Australian Prudential Regulation Authority (APRA) released final revisions on Prudential Standard SPS 530, Investment Governance to ensure better member outcomes through updated requirements that increase stress-testing, valuation and liquidity management practices.
The enhancements to strengthening investment governance have been in effect from January this year.
What are unlisted assets?
Unlisted assets are investments that are not traded through a public exchange or market, such as the Australian Securities Exchange (ASX) or the New York Stock Exchange (NYSE).
Investors in unlisted assets can either directly own the asset or invest with others through an unlisted trust.
The most common types of unlisted assets are:
- Unlisted property – from small property syndicates with assets such as neighbourhood shopping centres to multi-billion-dollar unlisted property trusts which own major CBD office buildings, large shopping centres or hotels.
- Unlisted infrastructure – development or ownership of roads, rail, ports, airports and utilities.
- Private equity – invest in or own private companies, including early stage investments in technology companies.
- Private credit – involves lending to privately owned businesses.
What are listed assets?
Listed assets are those that are traded on a stock exchange or share market, such as the ASX or NYSE.
The most common type of listed asset is shares, also known as equities.
Other listed assets include:
- Listed property – offers the ability to invest in a diverse portfolio of large properties through an Australian real estate investment trust or real estate investment trust on an international share market.
- Listed infrastructure trusts – trusts that invest in major infrastructure e.g. roads, rail and airports.
- Bonds – issued by a company or government to raise money which constitute a loan from an investor.
- Exchange traded funds (ETFs) – collection of assets that track the performance of a major investment index e.g. the S&P 500 Index.
- Managed funds – money from a number of investors which is pooled to buy investments.
How are unlisted and listed assets valued?
The difference in how unlisted and listed assets are valued is what affects super fund returns at any given time.
Timing of valuation
- Unlisted assets are typically valued at set intervals. For example, quarterly or annually.
- Listed assets are valued every day. Investors decide daily how much they are willing to pay for shares in the company or trust.
Method of valuation
- Valuations of unlisted assets are often made using historical or point-in-time factors. For example, unlisted property valuations are partly based on past sales of similar properties, which may have been completed when market conditions were different. As a result, values for unlisted assets are often different for the same asset in a listed market.
- Listed assets are valued by investors in an organised, open and transparent market. Valuations are an accurate, up to the minute reflection of what willing buyers and sellers in a market will pay.
Continued criticism is that valuations arranged by asset owners could lead to biased results if asset owners judge the value of their own investments too generously.
How does valuation timing impact your super’s performance?
The difference in valuation timing means changes in economic, competitive and market conditions are reflected in the value of listed assets more rapidly than unlisted assets. Therefore, listed asset values are affected more in the short term by market ups and downs versus unlisted assets.
Over the past months, central banks globally have sharply increased their interest rates in response to inflation. Rises in global and Australian interest rates have been quickly factored into prices for assets listed on stock exchanges. The result was an immediate fall in prices and losses for investors.
However, these significant changes may not yet be reflected in the valuations of unlisted assets.
Add to this the fluctuations in unlisted infrastructure and unlisted property funds, which many super funds are directly invested in, and the valuation of unlisted assets becomes a bigger issue.
Essentially, the difference in performance lowers returns in super funds, especially those holding mainly listed property, while funds holding mainly unlisted property have not yet been affected.
However, as unlisted property trusts go through their valuation cycles, downward returns are expected to be reported in those trusts, due to the significant devaluation risks in the higher interest rate environment.
Why is liquidity in super funds important?
Super is a long term investment and while you are accumulating your retirement savings, you may not need regular access to your money. However, super funds do need the flexibility to buy and sell investments to manage risk, respond to market conditions and take advantage of opportunities that arise.
Super funds also need to maintain liquidity to meet the redemptions of retiring investors, so the liquidity of investments is crucial at a fund level.
Source: Colonial First State
Understanding market volatility
By Robert Wright /December 01,2023/

Many investors become concerned when volatility occurs in global financial markets – particularly about the impact on their superannuation and other investments. In times like these, it’s important to understand the causes of market movements and how to minimise your risk.
Why do markets move so much?
Markets are influenced by many things – industrial, economic, political and social factors can all have an impact. For example, consumer and business confidence affect spending and therefore company profits.
Global trade and production naturally affect economic growth. Poor political and fiscal decisions in some countries may lead to a flow on effect in other countries who are owed money. And of course, natural disasters can cause major damage to any economy with no warning.
During times of market volatility, it’s important to remember one of the fundamental principles of investing – markets move in cycles.
What is the effect of market volatility on super funds?
In times of market volatility your super balance may decline but it is important to remember that markets move in cycles. Volatility is a natural part of the economic cycle. Markets are influenced by a range of factors and are inherently unpredictable.
The Australian Securities & Investments Commission (ASIC) states that, ‘negative returns from time to time are not inconsistent with successful long term investment’. History demonstrates that over the long term, the general trend of share markets has been upward.
Don’t lose sight of the bigger picture
Super is a long term investment. Shares, which usually form a large part of most balanced super accounts, are also generally a long term investment. They are designed to provide capital growth over a period of five years or more. Think in years, not days.
The time frame for super may be 20 years or more, so short term volatility shouldn’t diminish the long term potential of your investments. Growth assets (such as shares) tend to fluctuate in the short term but have historically provided excellent returns for investors over the long term.
When share markets fall in value, it may be tempting to sell up. However, trying to time the market by selling now and buying back later is a risky strategy that rarely results in investors coming out ahead. By taking a long term view of investing, you can ride out any short term fluctuations in the market and take advantage of growth opportunities over the long term.
Diversification
Diversification is one of the most effective ways of managing volatility. It can help deliver smoother, more consistent results over time. Your investment may benefit by being spread across a variety of asset classes, including shares (domestic and global), fixed income, cash, direct and listed property and alternatives.
This diversification should help soften the effects of any share market falls as some asset classes often tend to do well whilst others are struggling. Also, spreading your assets around means you are less reliant on any one asset class at any particular time.
Understand your risk profile
All investments carry some risk. How much risk you’re willing to accept will be influenced by your financial situation, family considerations, time horizon and even your personality. If market volatility has caused you to reassess the way you feel about risk, it’s important that you see your financial adviser to discuss any necessary changes to your financial plan.
Understanding the implications of withdrawing
Before you withdraw from an investment you should understand all the implications, risks and costs involved.
Locking in your losses. If the value of your investment is falling, you are technically only making a loss on paper. A rise in prices could soon return your investment to profit without you doing anything. Selling your investment makes any losses real and irreversible.
Incurring capital gains tax (CGT). Make sure you know what your CGT position will be before selling any asset.
Losing the benefits of compounding. If you’re thinking about making a partial withdrawal from an investment, remember that it’s not just the withdrawal you lose but all future earnings and interest on that amount.
Key takeaways
Keep in mind that:
- Super is a long term investment designed to generate sufficient money so you can enjoy your retirement.
- Diversification is an important part of a long term super investment strategy. To create the lifestyle you want in retirement, it may be necessary to invest in growth assets like shares so that your returns stay ahead of tax and inflation.
- It may be beneficial to ride out the bad times in order to achieve long term growth.
Your financial plan was designed exclusively for you to suit your investment objectives and risk profile. It’s important to stay focused on your long term goals.
Source: Colonial First State
Some recent questions on Australian inflation
By Robert Wright /August 21,2023/

Key points
- The Australian inflation rate peaked in the December quarter but has been slower to decline than some global peers. While interest rate rises are helping to reduce inflation (especially as discretionary consumer spending slows), rises in domestic energy prices, a tight rental market and a lagged pick up in wages have contributed to higher than expected inflation outcomes.
- The main policy available in the RBA’s toolkit to manage inflation is interest rates, which is a blunt tool because of its unequal impact on households with debt.
- The burden of interest rate increases falls on households with mortgage debt. Businesses and investors are also impacted but the deductibility of interest provides some offset.
- Some countries in Europe have opted to use price controls for essential items to reduce inflation, with mixed results. Price controls tend to add distortions to the market and rent controls are not helpful while housing supply is limited (like in Australia).
- But the government still has a role to play in helping the RBA achieve its 2-3% inflation target through keeping fiscal policy neutral/contractionary if inflation is high, ensuring a well functioning energy market, maintaining sustainable wage increases, regulating businesses to discourage price gouging and monopolistic behaviour and calibrating appropriate migration targets to match housing supply.
Introduction
Australian inflation is very high. Consumer prices were up by 7% over the year to March, around a 33-year high but this was a decline from a cyclical peak of 7.8% in December 2022. The Reserve Bank of Australia (RBA) has been focusing on reducing inflation through the main policy tool available in the central bank’s toolkit – interest rates. The cash rate has risen from 0.1% in April 2022 to 4.1% in June – a 4% lift in just over a year. But, the impact on inflation so far has been lower than expected. As a result, we are often asked whether interest rates are actually having an impact on inflation or whether there are better tools available to policymakers, especially as interest rate hikes are having an unequal impact across household groups. We go through some of these issues in this article.
Are interest rate hikes working to reduce inflation?
Interest rate hikes have led to a slowing in consumer demand which is helping to reduce inflation. Discretionary spending fell in the March quarter and the volumes of retail spending was negative over the December-March quarter. Without the lift in interest rates, inflation may have increased further and consumer and market-based medium-long term inflation expectations could have kept rising well above the RBA’s 2-3% inflation target.
Some might say that rate hikes should have worked faster or better by now to reduce inflation. The problem has been that there have been numerous supply driven elements of the inflation story that have been less sensitive to interest rate changes. COVID driven supply chain disruptions led to big increases in shipping costs, commodity prices like energy, metals and agriculture increased significantly in 2021-22 (mostly from supply disruptions), domestic energy supply issues led to an Australian energy crisis and multiple domestic floods led to higher food prices. While these issues may not be directly influenced by the level of change in interest rates, it is the responsibility of the RBA to ensure that supply driven price changes do not leak into consumer prices. A lot of these supply related issues are now resolved but it takes time for it to be reflected in the final inflation figures.
Evidence of excessive price gouging by businesses is not obvious. Profit margins have expanded (increasing from 10% in 2020 to a recent high of ~16%) but have generally moved in proportion to the rise in inflation (see the chart below) and are now declining. The profit share (ex mining) of GDP has also been fairly stable. And slowing consumer discretionary spending means that continued profit margin expansion will be unlikely.
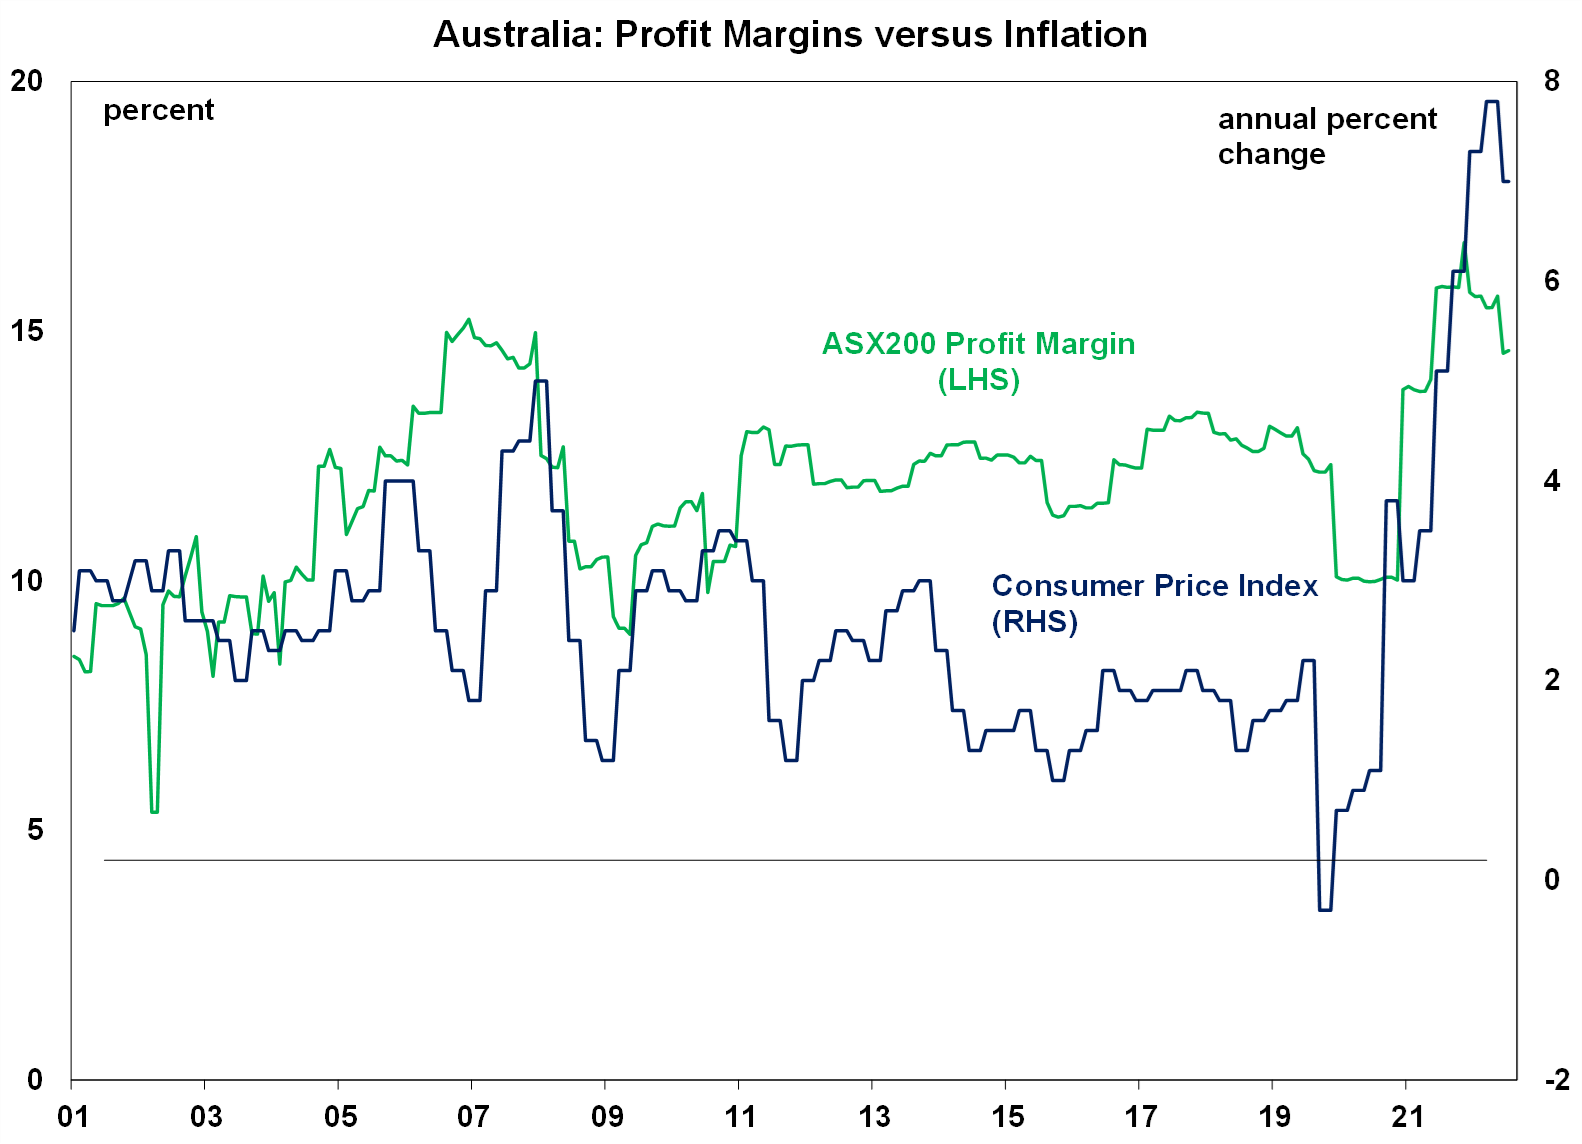
Source: Bloomberg, AMP
The peak of Australian inflation (in December 2022) also occurred later compared to some global peers which means that the slowing in inflation appears like it’s taking longer. US inflation peaked at 9.1% in June 2022 and in the Eurozone at 10.6% in October 2022 (see the next chart).

Source: Macrobond, AMP
Australia’s energy crisis occurred later relative to the Northern hemisphere, because of a raft of our own domestic issues like supply challenges with coal, a poor national plan for the energy transition and higher global prices. This meant that both the US and Europe were more impacted by an energy price surge in early 2022 from the war in Ukraine and the winter weather. Australia’s rental market also tightened significantly over the past year as net migration rebounded to record highs after the pandemic, pushing vacancy rates to ultra low levels in the capital cities and lifted rents, although recent vacancy rates across the capital cities have ticked up and newly advertised rental growth is slowing. Australia’s wage setting system also seems to have more “inertia”, with the minimum wage decision occurring once a year and many other wages like awards also based off this annual decision or driven by changes to headline inflation, which only peaked in December 2022.
While these factors all suggest that inflation in Australia could remain higher for longer for now, the good news is that our Pipeline Inflation Indicator still suggests significant downside to Australian inflation over the next six months and we expect headline consumer prices to be at the top end of the RBA’s target band by early 2024 (on a 6-month annualised basis).

Source: Bloomberg, AMP
Are interest rate hikes increasing inequality?
The impact of monetary policy works primarily through the lending channel because borrowing rates are priced off the cash rate. Households with a mortgage are the most impacted by interest rate changes. Businesses and individual investors are arguably less impacted because they can deduct the debt interest expenses. There are also other financial market channels that monetary policy works through, mostly through the exchange rate.
The high level of household debt now means that mortgage holders will bear the brunt of monetary policy changes. Renters can also be affected from higher interest rates if landlords are able to pass on the higher cost of debt servicing through higher rents. This is only usually an option in a tight rental market (which the current situation is allowing for).
In Australia, 37% of households have a mortgage (using data from 2019-20), 29% rent and 30% own their own outright. Detailed ABS data on housing costs shows that households with a mortgage spend close to 16% of their gross household income on “housing costs” (mortgage or rent and rate payments) as at 2019-20, owners without a mortgage spend 3% of their income on housing costs and the average renter spends close to 20% of their income on housing. And there are divergences across income quintiles (see the chart below) with the lowest income quintiles spending a very large share of income on housing costs.

Source: Bloomberg, AMP
Are there other options to combat high inflation?
The high degree of supply related factors that have increased inflation, the slow reduction in prices despite aggressive interest rate hikes and the high burden placed on households with a mortgage has led to questions about whether there are other options available to reduce the level of inflation.
The RBA has been tasked with the responsibility for the 2-3% inflation target but the only tool at its disposal is monetary policy. While the range of options within the toolkit has expanded beyond interest rates (including yield targets and quantitative easing) all of these measures ultimately influence the money supply and therefore the cost of borrowing.
The government has more tools at its disposal compared to the RBA through its spending and taxation decisions as well as regulation. However, these tools are slow moving and do not have as much of a direct impact on inflation. Some have argued that price controls need to be considered in Australia. Food price caps have recently been tried in Europe for some essential items, including in France, Croatia and Hungary with mixed impacts as measured inflation went down but there were reports of some food shortages.
Usually, economists do not advocate for price controls or caps because it’s a distortion in the market and leads to problems like supply shortages. However, the Federal government did impose energy price caps domestically, so it is already being utilised in some capacity. Talk of rent controls would likely add to supply constraints across Australia at a time when housing supply needs to lift.
But, the government does have a role to play in many components that impact inflation, such as by ensuring a well regulated electricity market, sustainable outcomes for minimum award and public sector wages which set the tone for the rest of the market, ensuring that fiscal policy (both state and federal) is appropriate for the state of the economy (we think the impact of the May Federal budget is more or less neutral but with the addition of some state cost of living benefits it could be marginally inflationary and the government could consider raising taxes to help get inflation down), regulation of retailers to ensure adequate competition and ensuring adequate housing for the migration targets.
Implications for investors
For investors, the good news is that inflation is expected to decline through the rest of the year which should mean that central banks are close to the top of their tightening cycles. This is generally positive for sharemarkets however, the further interest rates increase, the higher the risk of recession which is a risk for sharemarkets. The RBA’s recent hawkish stance means that further increases to the cash rate are likely in Australia. We expect another two interest rate increases from here, taking the cash rate to 4.6% which risks a recession in the next 12 months because of the heightened sensitivity of households to interest rate hikes in Australia.
Source: AMP
Your guide to gearing
By Robert Wright /August 21,2023/

There are a number of considerations when it comes to gearing, the investment assets you may choose to gear and the way you structure your debt.
A gearing strategy can be set at three levels:
- Positive gearing – where income from the investment exceeds the interest payable on the loan.
- Neutral gearing – where income from the investment is equal to the interest payable on the loan.
- Negative gearing – where the income from the investment is less than the interest payable on the loan. The excess interest expense is an allowable deduction against other assessable income, which for a taxpayer on the top marginal rate is currently worth 47% (inclusive of the Medicare levy).
Investing in growth assets such as shares or property using borrowed funds can be one of the most effective ways to accumulate wealth over the long term.
Investors are solely relying on a future capital gain when undertaking a negative or neutral gearing strategy. Negative gearing is tax effective in that the interest expense is fully deductible against the income generated by the geared investment and other assessable income. There are also other tax breaks such as the deductibility of depreciation (for property) and franking credits (for shares) to help subsidise the cost of the investment. In addition, for individuals, 50% of any capital gain is exempt from tax where the investment is held for at least 12 months.
Examples
Positive gearing strategy
If $100,000 were invested for a year in assets that produced a return on investment of 10% per annum, the total return on investment would be $10,000.
If the investor had also used a gearing strategy and borrowed $50,000 (at a cost of 7% per annum) and invested this in the same assets producing the same 10% per annum return, the return on investment would be 10%, less the cost of finance (7%) – that is, a net additional return of $1,500 using someone else’s money.
The net return can be greater than this when the tax deductibility of interest is taken into consideration.
The below examples of negative gearing illustrate how the negative cash flow from the investment can be offset by the deductibility of interest plus other tax breaks.
Negative gearing an investment property
Sarah earns a salary of $200,000 and borrows $400,000 to buy an investment property. The property generates rental income of $20,000 per annum while interest expense on the loan (interest only with no principal repayments) is 7% or $28,000 per annum. In addition to the deductible interest expense, there are the following ‘non-cash’ deductions:
- $2,500 depreciation
- $4,500 building amortisation (2.5% based on a construction cost of $180,000)
| Financial position | Without negative gearing strategy | With negative gearing strategy |
| Salary | $200,000 | $200,000 |
| Rental income | – | $20,000 |
| Non-cash property deductions | – | $7,000 |
| Interest expense | – | $28,000 |
| Taxable income | $200,000 | $185,000 |
| Tax payable (incl. Medicare levy) | $64,667 | $57,617 |
| Net cash | $135,333 | $134,383 |
The difference in cash flow of only $950 has been assisted by the $7,000 tax deduction for the non-cash depreciation and building amortisation expenses.
These examples demonstrate the worth of tax deductions to an individual on the top marginal tax rate in the first year of a negative gearing strategy. Over time, negatively geared investments can become positively geared – especially when rental income or dividends are reinvested.
Couples with one person on a higher marginal tax rate than the other, should carefully consider who should be the borrower and owner of investments over the long term. While initially it may be tax effective to have a negatively geared investment in the name of the person with the highest tax rate, if it’s expected to become positively geared in the future, it may be more effective to have the loan and investment in the name of the person with the lower marginal tax rate from the outset. Especially when you consider the potential capital gains tax, stamp duty and loans fees that might be incurred in transferring the investment and loan.
Trusts and companies can also negatively gear investments, however the following should be considered:
- Trusts and companies cannot distribute losses, they need to be carried forward and offset against future assessable income.
- While the company tax rate is 30% for companies that are not base-rate entities which have a tax rate of 25%, companies are fully assessed on capital gains as opposed to the 50% discount applied to assets held for 12 months or more by individuals and trusts.
Negative gearing a share portfolio
Sarah earns a salary of $200,000 and borrows $400,000 to invest in a share portfolio. The share portfolio generates a dividend yield of 4% fully franked, while the interest expense on the loan (interest only loan) is 7% per annum under a line of credit secured against her home.
The below table illustrates the impact the negative gearing strategy has on Sarah’s cash flow.
| Financial position | Without negative gearing strategy | With negative gearing strategy |
| Salary | $200,000 | $200,000 |
| Dividend | – | $16,000 |
| Imputation gross up | – | $6,857 |
| Interest expense | – | $28,000 |
| Taxable income | $200,000 | $194,857 |
| Tax payable (incl. Medicare levy) | $64,667 | $62,250 |
| Franking credit | – | $6,857 |
| Tax payable (incl. Medicare levy) and after franking credit | $64,667 | $55,393 |
| Net cash | $135,333 | $132,607 |
The difference in cash flow is $2,726 which is approximately 0.7% of the investment portfolio. Sarah hopes that her after-tax capital gain will be greater than this cash flow loss.
Source: BT